An online cryptocurrency exchange platform is hosted in AWS which uses ECS Cluster and RDS in Multi-AZ Deployments configuration. The application is heavily using the RDS instance to process complex read and write database operations. To maintain the reliability, availability, and performance of your systems, you have to closely monitor how the different processes or threads on a DB instance use the CPU, including the percentage of the CPU bandwidth and total memory consumed by each process .
Which of the following is the most suitable solution to properly monitor your database?
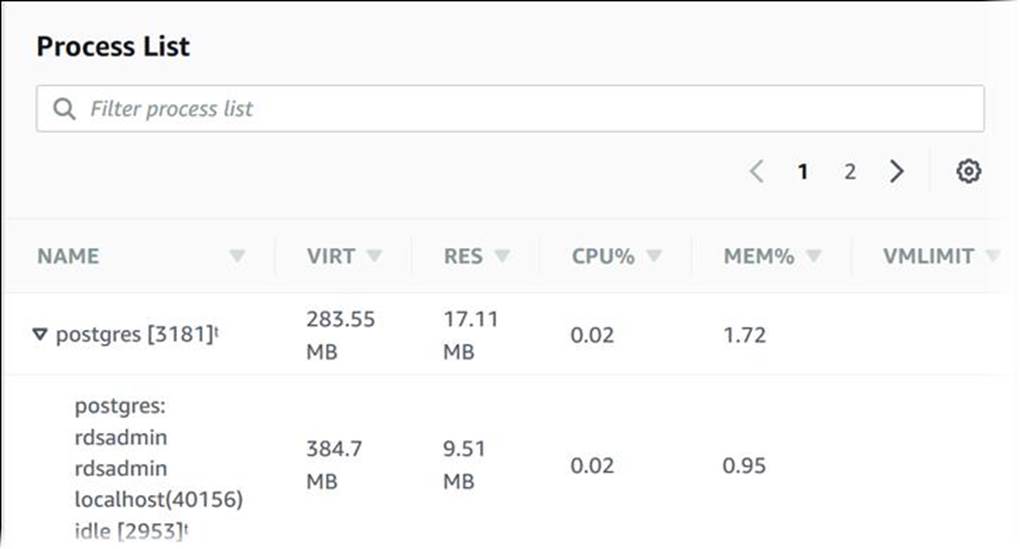
A . Check the CPU% and MEM% metrics which are readily available in the Amazon RDS console that shows the percentage of the CPU bandwidth and total memory consumed by each database process of your RDS instance.
B . Use Amazon CloudWatch to monitor the CPU Utilization of your database.
C . Enable Enhanced Monitoring in RD
E . Create a script that collects and publishes custom metrics to CloudWatch, which tracks the real-time CPU Utilization of the RDS instance, and then set up a custom CloudWatch dashboard to view the
metrics.
Answer: C
Explanation:
Amazon RDS provides metrics in real time for the operating system (OS) that your DB instance runs on. You can view the metrics for your DB instance using the console, or consume the Enhanced Monitoring JSON output from CloudWatch Logs in a monitoring system of your choice. By default, Enhanced Monitoring metrics are stored in the CloudWatch Logs for 30 days. To modify the amount of time the metrics are stored in the CloudWatch Logs, change the retention for the RDSOSMetrics log group in the CloudWatch console.
Take note that there are certain differences between CloudWatch and Enhanced Monitoring Metrics. CloudWatch gathers metrics about CPU utilization from the hypervisor for a DB instance, and Enhanced Monitoring gathers its metrics from an agent on the instance. As a result, you might find differences between the measurements, because the hypervisor layer performs a small amount of work. Hence, enabling Enhanced Monitoring in RDS is the correct answer in this specific scenario.
The differences can be greater if your DB instances use smaller instance classes, because then there are likely more virtual machines (VMs) that are managed by the hypervisor layer on a single physical instance. Enhanced Monitoring metrics are useful when you want to see how different processes or threads on a DB instance use the CPU.
Using Amazon CloudWatch to monitor the CPU Utilization of your database is incorrect. Although you can use this to monitor the CPU Utilization of your database instance, it does not provide the percentage of the CPU bandwidth and total memory consumed by each database process in your RDS instance. Take note that CloudWatch gathers metrics about CPU utilization from the hypervisor for a DB instance while RDS Enhanced Monitoring gathers its metrics from an agent on the instance.
The option that says: Create a script that collects and publishes custom metrics to CloudWatch, which tracks the real-time CPU Utilization of the RDS instance and then set up a custom CloudWatch dashboard to view the metrics is incorrect. Although you can use Amazon CloudWatch Logs and CloudWatch dashboard to monitor the CPU Utilization of the database instance, using CloudWatch alone is still not enough to get the specific percentage of the CPU bandwidth and total memory consumed by each database processes. The data provided by CloudWatch is not as detailed as compared with the Enhanced Monitoring feature in RDS. Take note as well that you do not have direct access to the instances/servers of your RDS database instance, unlike with your EC2 instances where you can install a CloudWatch agent or a custom script to get CPU and memory utilization of your instance.
The option that says: Check the CPU% and MEM% metrics which are readily available in the Amazon
RDS console that shows the percentage of the CPU bandwidth and total memory consumed by each
database process of your RDS instance is incorrect because the CPU% and MEM% metrics are not
readily available in the Amazon RDS console, which is contrary to what is being stated in this option.
References:
https://docs.aws.amazon.com/AmazonRDS/latest/UserGuide/USER_Monitoring.OS.html#USER_Monitor
ing.OS.CloudWatchLogs
https://docs.aws.amazon.com/AmazonRDS/latest/UserGuide/MonitoringOverview.html#monitoring-cloud
watch
Check out this Amazon CloudWatch Cheat Sheet: https://tutorialsdojo.com/amazon-cloudwatch/ Check out this Amazon RDS Cheat Sheet: https://tutorialsdojo.com/amazon-relational-database-service-amazon-rds/
Latest SAA-C03 Dumps Valid Version with 400 Q&As
Latest And Valid Q&A | Instant Download | Once Fail, Full Refund
