HOTSPOT
You need to create the solution assets.
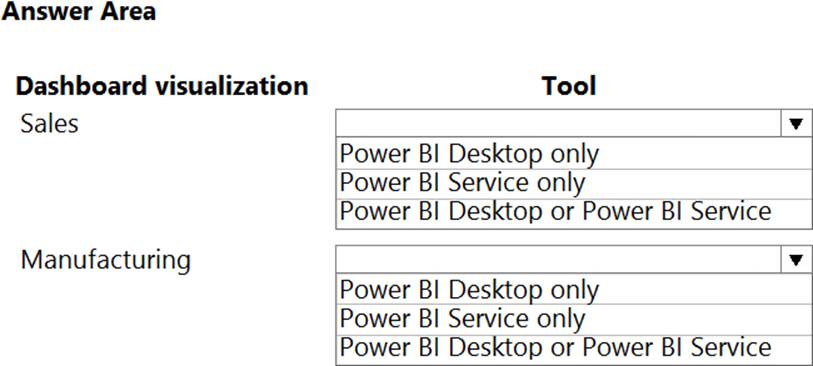
What should you use to create the visualizations? To answer, select the appropriate options in the answer area. NOTE: Each correct selection is worth one point.
Answer: 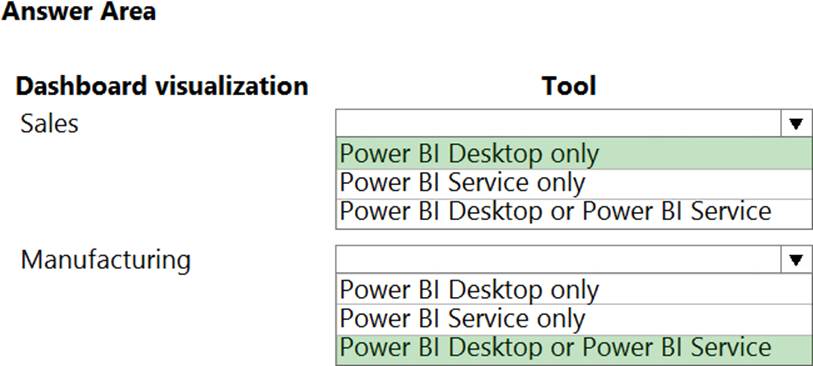
Explanation:
Box 1: PowerBI Desktop
The Sales dashboard must reside in the Sales channel and must include information about active quotes, sales pipeline, and year-to-date sales KPIs for sales quotas by region.
PowerBI Desktop to support many data source.
Box 2: PowerBI Desktop or Power BI Service on
A dashboard that shows a capacity Heat map by month as well as expected sales that are likely to close for the next month.
Both support visualizations.
Latest PL-100 Dumps Valid Version with 86 Q&As
Latest And Valid Q&A | Instant Download | Once Fail, Full Refund
