What does a trendline in a burndown chart describe?
A . All of the answers.
B. When all remaining tasks are expected to be completed.
C. The actual remaining effort.
D. When all remaining tasks will be completed.
E. When all technical tasks are expected to be completed.
F. When all technical tasks will be completed.
Answer: C
Explanation:
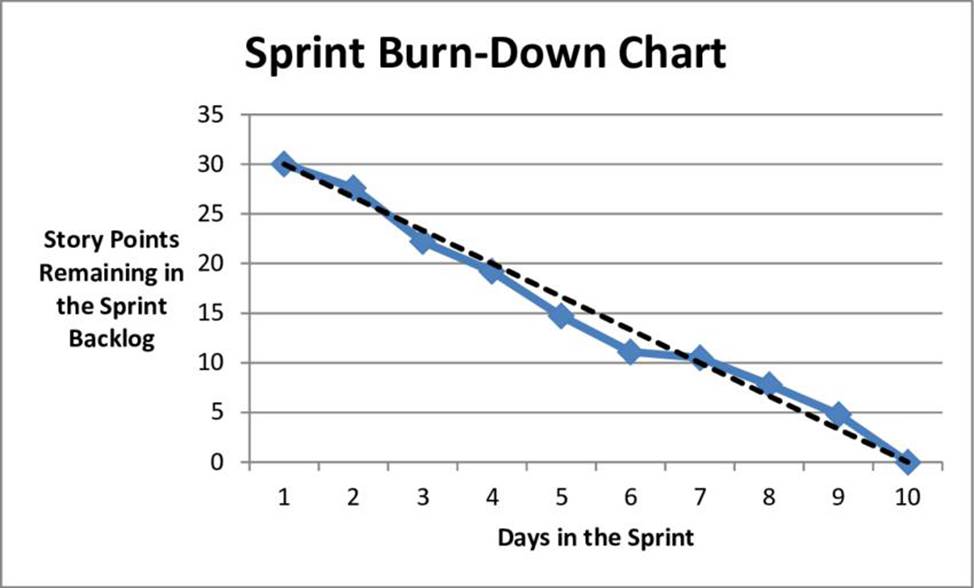
A burn down chart is a graphical representation of work left to do versus time. The outstanding work (or backlog) is often on the vertical axis, with time along the horizontal. Burn down charts are a run chart of outstanding work. It is useful for predicting when all of the work will be completed. The goal of a burn down chart is to display the progress toward completion and give an estimate on the likelihood of timely completion. The horizontal axis of the sprint burndown chart represents the days within a sprint, whereas the vertical axis represents the remaining estimated effort-hours. The chart should be updated every day to exhibit the total estimated effort remaining across all the uncompleted tasks.
In the burndown chart, you can typically see:
– X-Axis: The project/iteration timeline.
– Y-Axis: The work that needs to be completed for the project. The time or story point estimates for the work remaining will be represented by this axis.
– Ideal Work Remaining Line / Trend line: This is a straight line that connects the start point to the end point. At the start point, the ideal line shows the sum of the estimates for all the tasks (work) that needs to be completed. At the end point, the ideal line intercepts the x-axis showing that there is no work left to be completed.
– Actual Work Remaining Line: This shows the actual work remaining. At the start point, the actual work remaining is the same as the ideal work remaining but as time progresses, the actual work line fluctuates above and below the ideal line depending on this disparity between estimates and how effective the team is. In general, a new point is added to this line each day of the project. Each day, the sum of the time or story point estimates for work that was recently completed is subtracted from the last point in the line to determine the next point.
Latest PAL-I Practice Questions with 305 Q&As
Updated Study Material | Instant Download | Detailed Answers and Explanations