Which of the following is a good reason for using a bullet graph?
A . Comparing the actual sales against the target sales
B . Analysing the trend over a given time period
C . Forecasting future sales
D . Displaying the year-on-year growth in sales
Answer: A
Explanation:
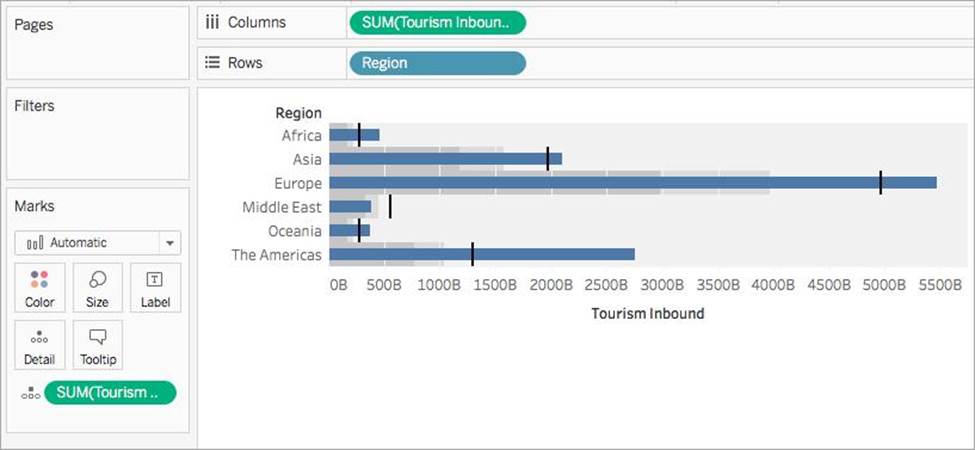
A bullet graph is a variation of a bar graph developed to replace dashboard gauges and meters. A bullet graph is useful for comparing the performance of a primary measure to one or more other measures. Below is a single bullet graph showing how actual sales compared to estimated sales.
Reference: https://help.tableau.com/current/pro/desktop/en-us/qs_bullet_graphs.htm
Latest TDS-C01 Dumps Valid Version with 151 Q&As
Latest And Valid Q&A | Instant Download | Once Fail, Full Refund
