DOWNLOAD THE DATASET FROM: https://drive.google.com/drive/folders/1WXzqsrNmXVdmQ-574wld4InEplyKT8RP?usp=sharing (if you haven’t already)
Using the cwurData table, plot a Map to see which country had the Second highest number of patents in the Year 2013?
A . United States
B . France
C . United Kingdom
D . Canada
Answer: B
Explanation:
Follow along to get the correct answer:
Drag Country to the view, and then Patents to the Size Mark on the Marks shelf as follows:
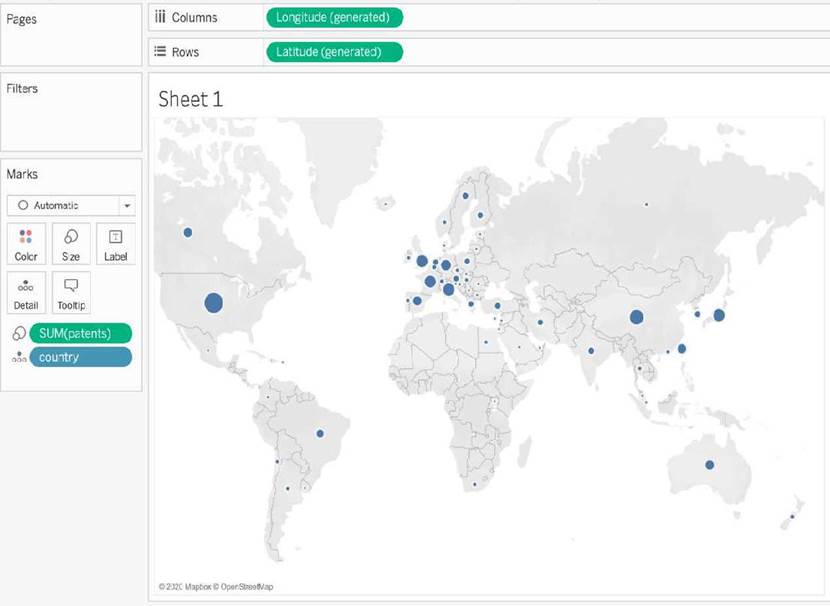
2) But, this isn’t all right? We need to focus on the year 2013.
This can be done by using the year column as it is (continuous) in the filter shelf, or by converting it to discrete first and then using it:
Latest TDS-C01 Dumps Valid Version with 151 Q&As
Latest And Valid Q&A | Instant Download | Once Fail, Full Refund
