Using the Time Series table, create a chart that shows the percent difference in Average Inventory on Hand for each Assortment by year and quarter.
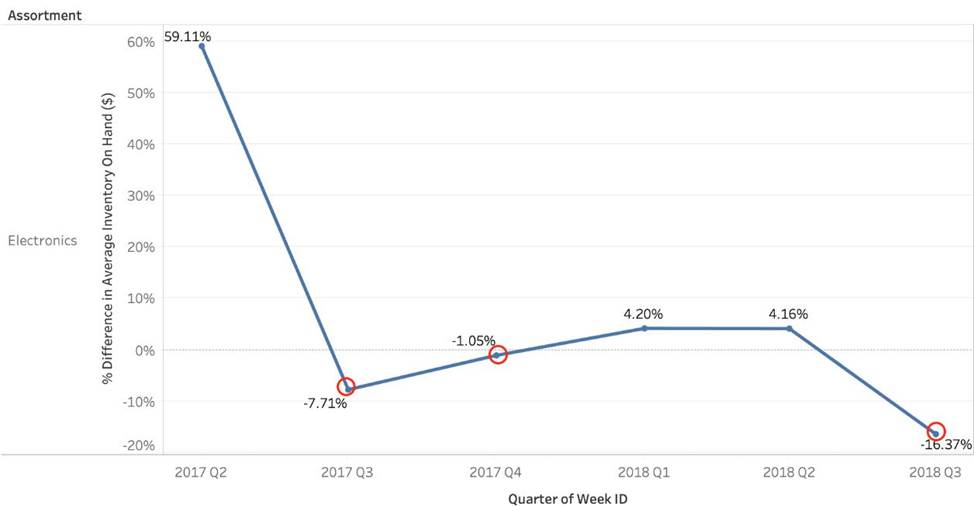
How many quarters did the Electronics Assortment show a negative percent difference in the Average Inventory On Hand?
A . 1
B . 2
C . 3
D . 4
Answer: C
Explanation:
If you chose 2, then you were very close but probably didn’t plot the actual Percent Difference on your view. (One of the marks is just over the line).
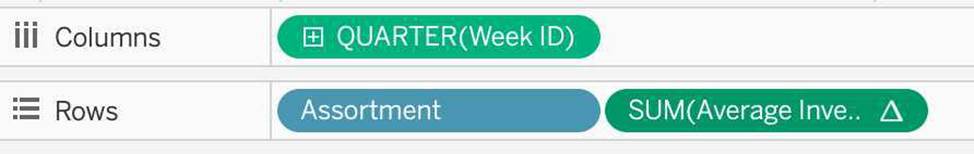
✑ Firstly, Drop the Week ID onto the column shelf, and convert it to continuous since we need both Year and Quarter as mentioned in the question.
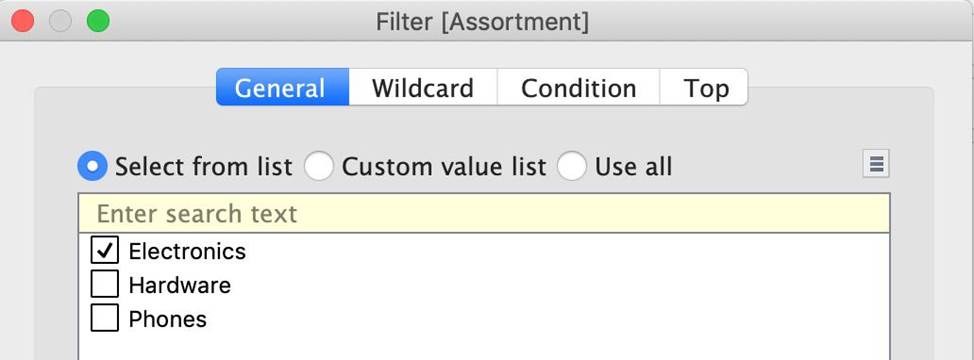
2) Next, Drop assortment to filters shelf so that we can focus on Electronics!
3) This should be your view now. Click on the Show Mark Labels icon as shown: The final view is as follows, with 3 points below 0 ( i.e negative )
Latest TDS-C01 Dumps Valid Version with 151 Q&As
Latest And Valid Q&A | Instant Download | Once Fail, Full Refund
