Download the Dataset from:
https://drive.google.com/file/d/12AYHfiPWkwBmvH0zbumOURgUX6Az00Rw/view?usp=sharing
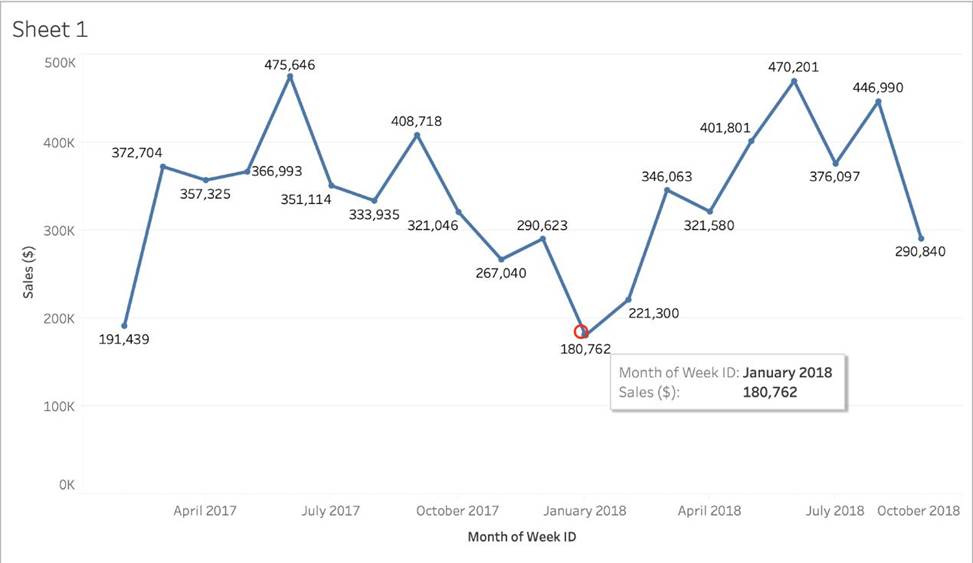
Using the Time Series Table, create a line chart to show Sales over time.
Which Month and Year witnessed the lowest Sales?
A . September 2017
B . March 2018
C . December 2017
D . January 2018
Answer: D
Explanation:
Follow the steps to get the correct answer: January 2018
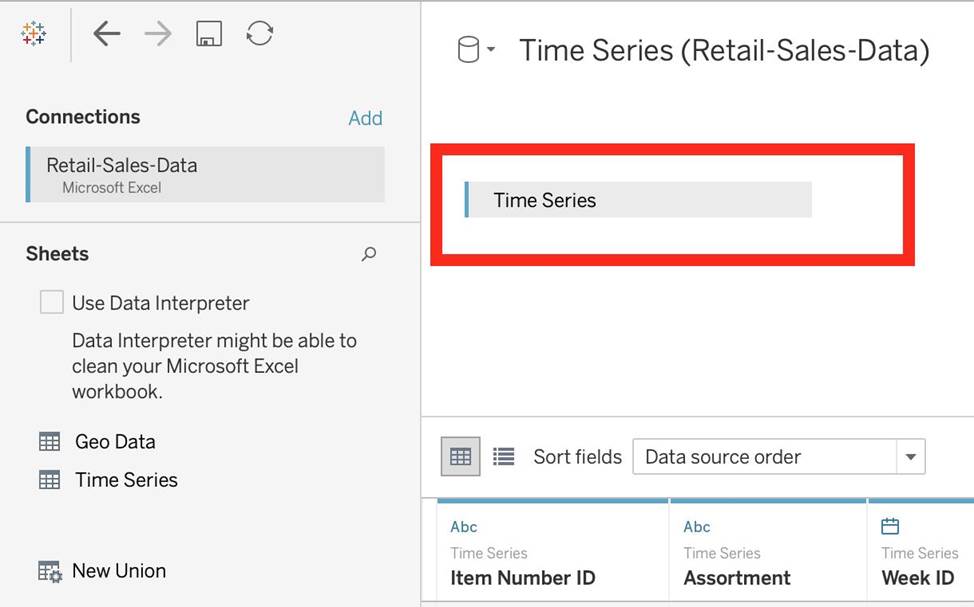
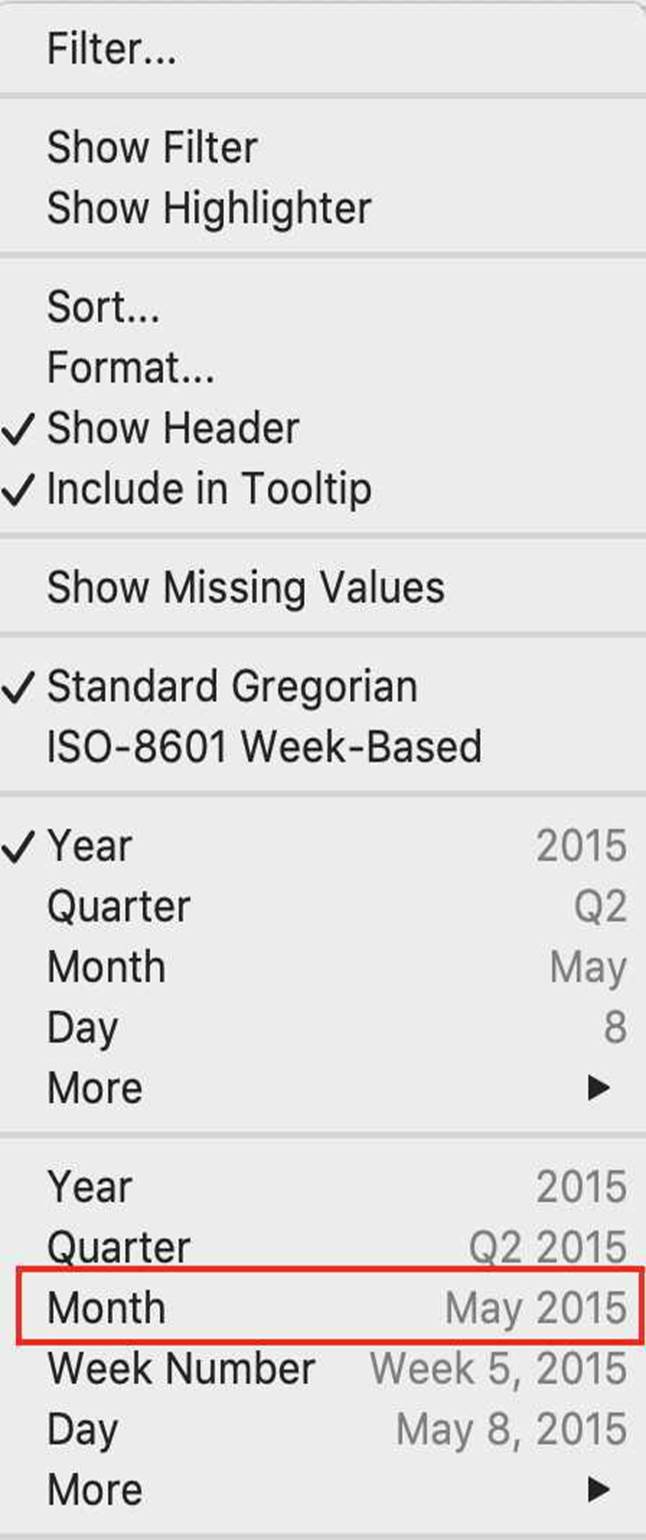
We are talking about dates, so use the Time series sheet as follows:
Next, the following should be your view and clearly, January 2018 is the lowest point:
Read more about dates: https://interworks.com/blog/rcurtis/2017/01/30/tableau-deep-dive-dates-introduction-dates/
Latest TDS-C01 Practice Questions with 151 Q&As
Updated Study Material | Instant Download | Detailed Answers and Explanations