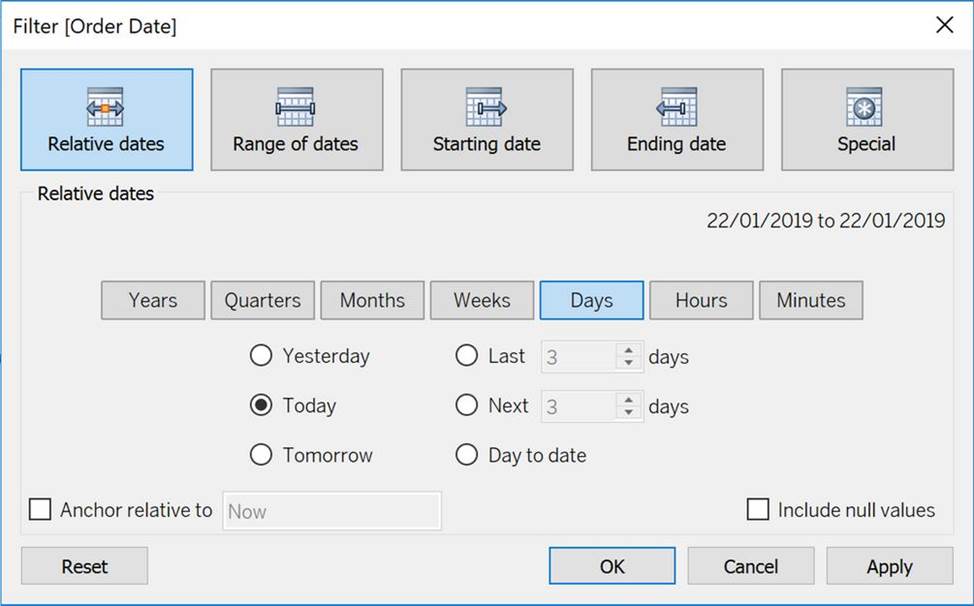
If you see the following Filter, then you’re working with _______________________ Larger image
A . Grouped Dates
B . Date Functions
C . Date Parts
D . Date Values
Answer: D
Explanation:
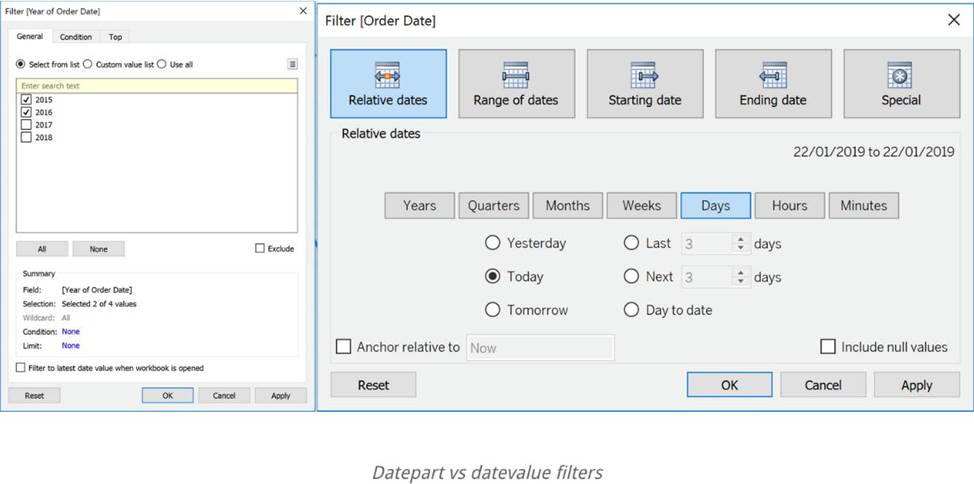
Dates in Tableau will behave differently depending on whether they are a Datepart (blue) or a Datevalue (green). This affects how the axes display/behave and also how visualisations such as line charts will display. The difference essentially boils down to Dateparts behaving like a dimension as opposed to a measure which is how Datevalues behave. This means that Dateparts behave like discrete categories on the view whereas Datevalues are more like continuous numeric values.
Dateparts are discrete and they behave the same as dimension filters. If all dates are used on the filter then each individual date will be a datepart that can be selected/excluded. This is the same for each level of date, if datepart months is placed on filters January to December will be tick-able options in the filter. This also means that conditions and top/bottom filters can be applied to datepart filters like any other dimension filter. Datevalues placed on filters behave like measure filters. A min and a max date can be set and there is a relative dates option which allows you to choose things like only show the previous 3 months or years etc.
Reference: https://www.thedataschool.co.uk/harry-cooney/tableau-dateparts-vs-datevalues/
Latest TDS-C01 Dumps Valid Version with 151 Q&As
Latest And Valid Q&A | Instant Download | Once Fail, Full Refund
