Which of the following can you use to create a Histogram?
A . 2 measures
B . 1 measure
C . 2 dimensions
D . 1 dimension
Answer: B
Explanation:
A histogram is a chart that displays the shape of a distribution. A histogram looks like a bar chart but groups values for a continuous measure into ranges, or bins.
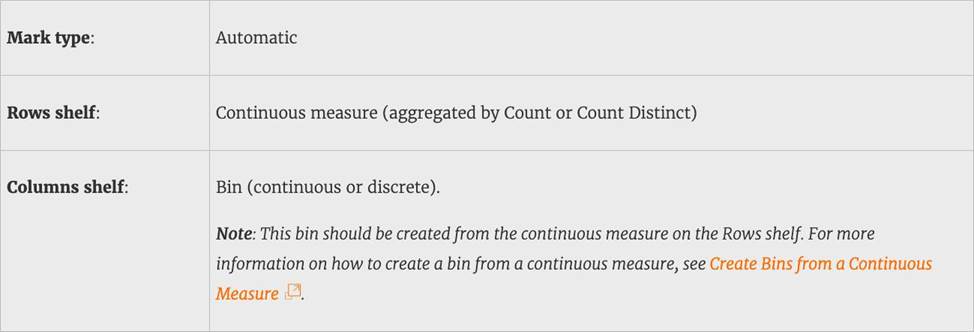
The basic building blocks for a histogram are as follows:
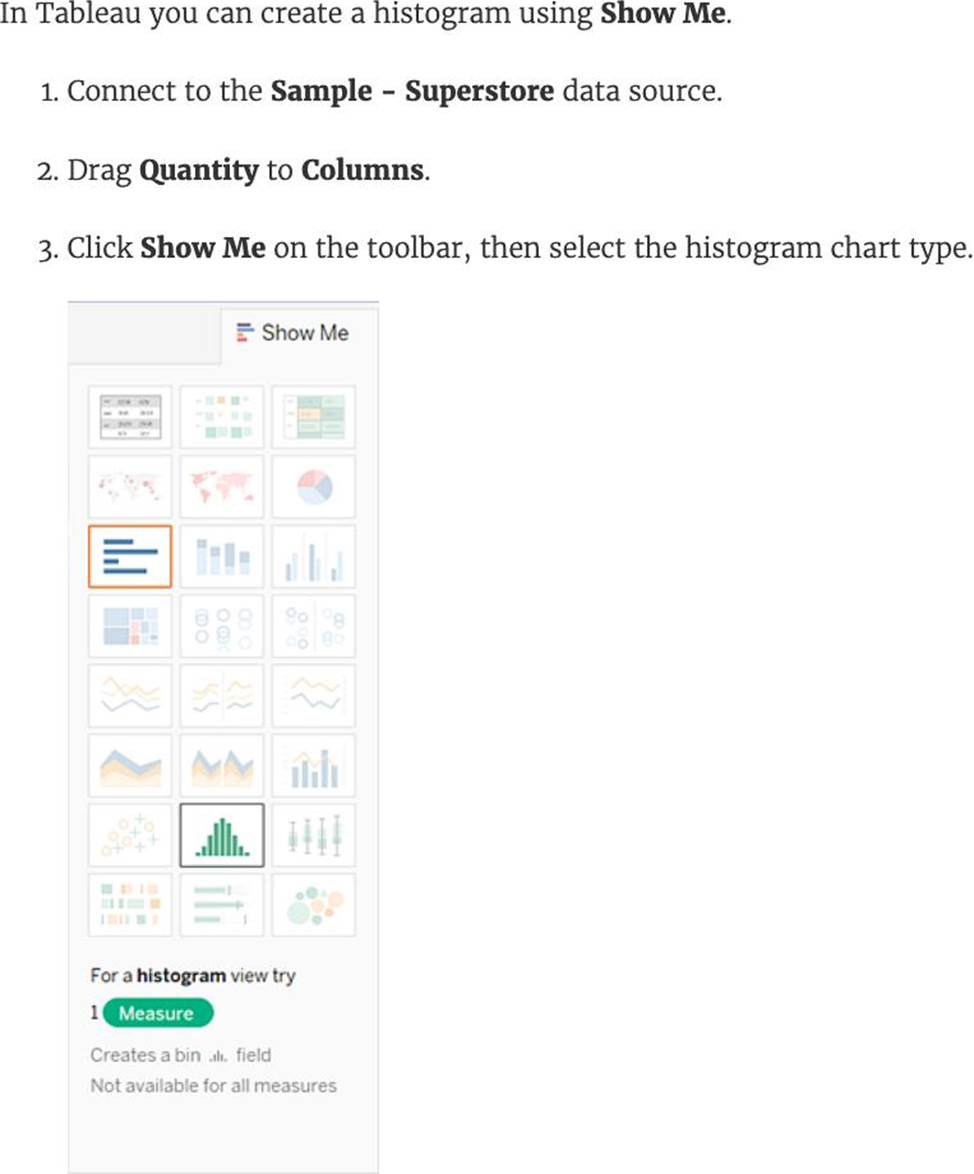
Demo:
Reference: https://help.tableau.com/current/pro/desktop/en-us/buildexamples_histogram.htm
Latest TDS-C01 Dumps Valid Version with 151 Q&As
Latest And Valid Q&A | Instant Download | Once Fail, Full Refund
