HOTSPOT
You need to create a visual as shown in the following exhibit.
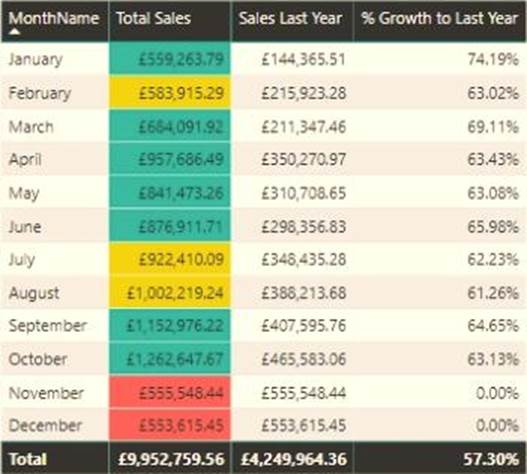
The indicator color for Total Sales will be based on % Growth to Last Year.
The solution must use the existing calculations only.
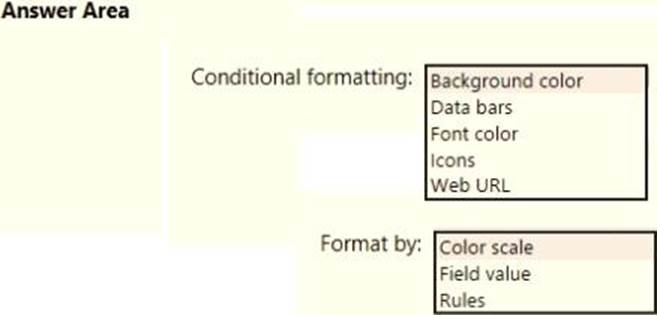
How should you configure the visual? To answer, select the appropriate options in the answer area. NOTE: Each correct selection is worth one point.
Answer: 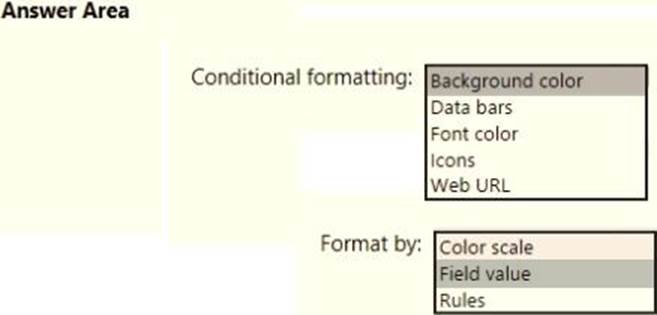
Explanation:
Box 1: Background color
To format the Color column based on its field values, select Conditional formatting for the Color field, and then select Background color or Font color.
In the Background color or Font color dialog box, select Field value from the Format by drop-down field.
Box 2: Field value
With conditional formatting for tables in Power BI Desktop, you can specify customized cell colors, including color gradients, based on field values.
Reference: https://docs.microsoft.com/en-us/power-bi/create-reports/desktop-conditional-table-formatting
Latest PL-300 Practice Questions with 131 Q&As
Updated Study Material | Instant Download | Detailed Answers and Explanations