Yes or No: The number of marks will increase when you increase the number of Dimensions in a view
A . No
B. Yes
Answer: B
Explanation:
Of course! As an example, see below:
1) Using the Sample Superstore data, let’s plot a bar chart showing the Sales for each Category:
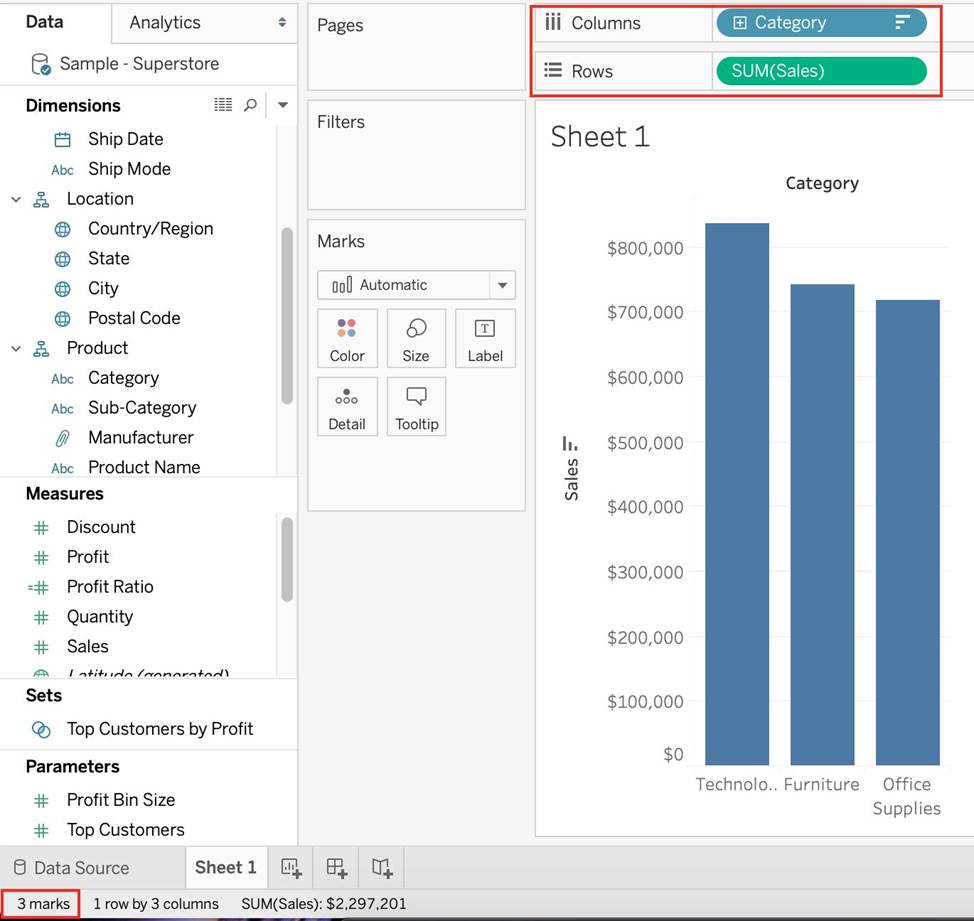
Observe that we have 3 marks – Each bar in a bar chart is called a mark. Similarly, each point in a scatter plot is also a mark, and so on for all charts.
1 row by 3 columns means that clearly on the y-axis (Sales), we have only a single mark – a single continous axis, but 3 different marks (Technology, Furniture and Office supplies) on the x-axis.
2) Now let’s add subcategory to the view as well (another dimension):
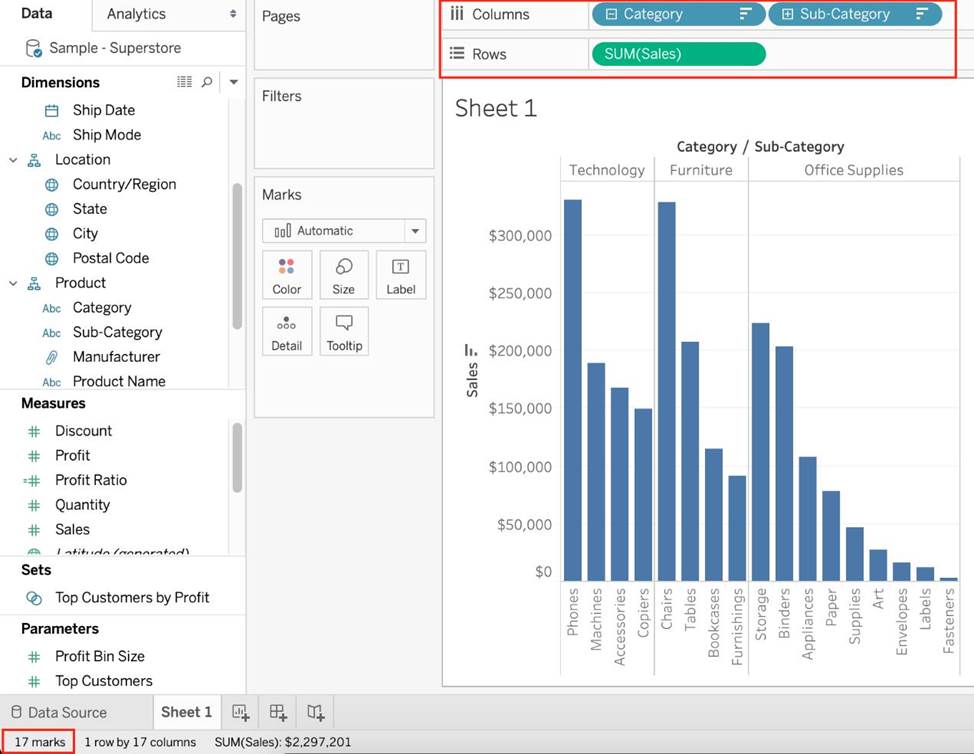
Observe that the number of marks has increased – i.e the number of Bars.
Also, notice we now have 1 row and 17 columns. Simply because 1 row = Sales (on the y-axis), and on the x-axis, we have 17 different columns (i.e product sub categories!!)
Latest TDS-C01 Dumps Valid Version with 151 Q&As
Latest And Valid Q&A | Instant Download | Once Fail, Full Refund
