Using the Time Series Table, create a Line chart showing the Monthly Year over Year Growth for the Sales, broken down by Assortment.
For the Electronics assortment, which Month had the most NEGATIVE value of Year over Year Growth?
A . October
B. September
C. July
D. June
Answer: A
Explanation:
Follow along:
1) Drag Assortment and Year ID (choose Discrete Month) to Columns shelf, and Sales to the Columns Shelf.
For sales, click on the pill -> choose Quick Table calculation -> Year over Year growth.
The view should now look like:
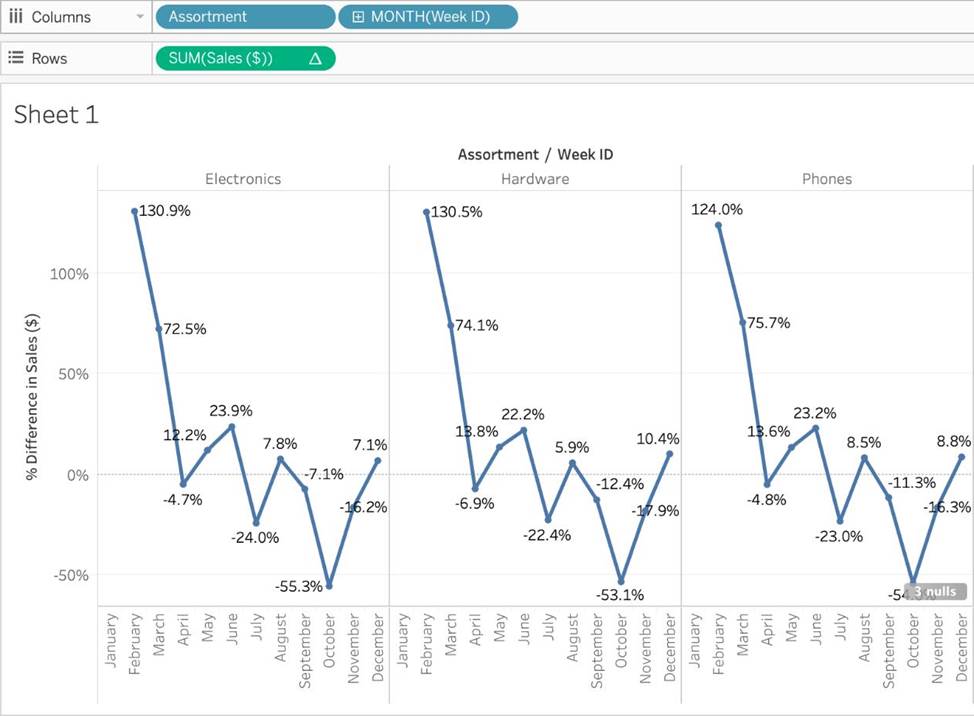
It is clear that October with -55.3% had the lowest Year on Year growth.
Latest TDS-C01 Dumps Valid Version with 151 Q&As
Latest And Valid Q&A | Instant Download | Once Fail, Full Refund
