One of your joins is taking a lot of time. The query profile view looks like this.
What may be the issue?
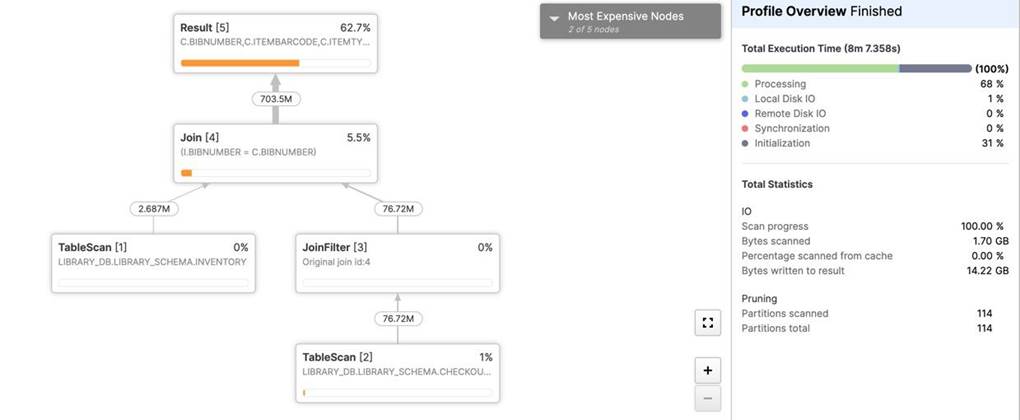
A . This may be an "exploding join" issue. The query has provided a condition where records from one table match multiple records from another table resulting in a cartesian product
B. There is not enough memory to process the join query
C. Looks like tablescan is the most expensive operation in the profile.
Answer: A
Explanation:
This is a very important question and again this is something that will need some work experience and
good understanding of snowflake concepts
This is a possible case of "Exploding Joins".
One of the common mistakes SQL users make is joining tables without providing a join condition (resulting in a "Cartesian Product"), or providing a condition where records from one table match multiple records from another table. For such queries, the Join operator produces significantly (often by orders of
magnitude) more tuples than it consumes.
This can be observed by looking at the number of records produced by a Join operator, and typically is also reflected in Join operator consuming a lot of time.
Latest ARA-C01 Practice Questions with 156 Q&As
Updated Study Material | Instant Download | Detailed Answers and Explanations