HOTSPOT
You are analyzing the asymmetry in a statistical distribution.
The following image contains two density curves that show the probability distribution of two datasets.
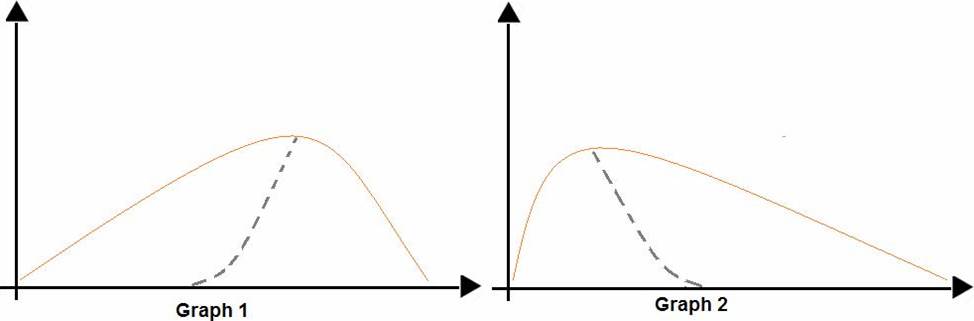
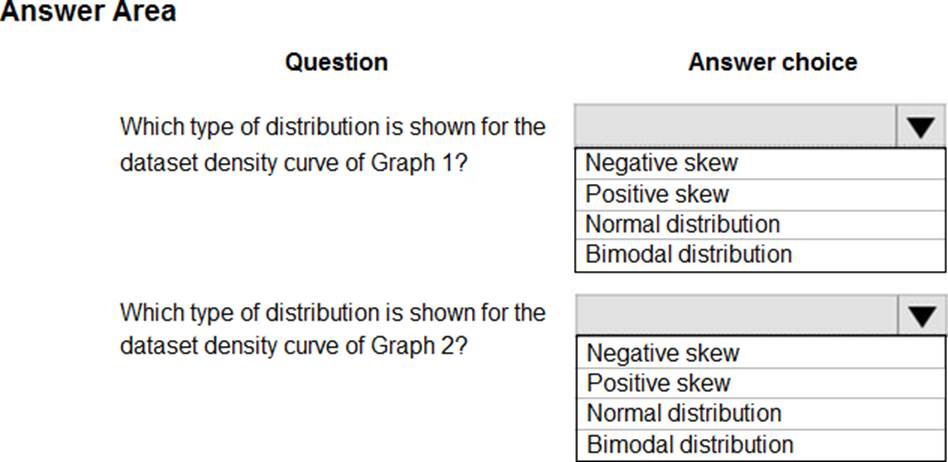
Use the drop-down menus to select the answer choice that answers each question based on the information presented in the graphic. NOTE: Each correct selection is worth one point.
Answer: 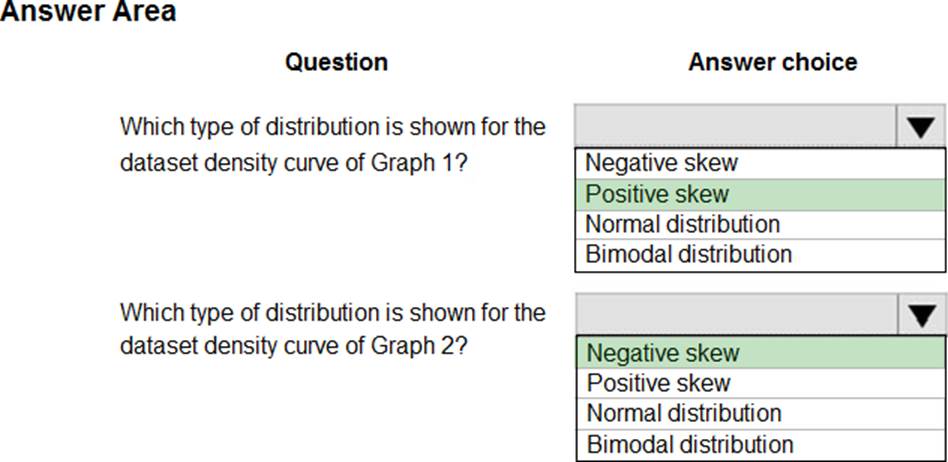
Explanation:
Box 1: Positive skew
Positive skew values means the distribution is skewed to the right.
Box 2: Negative skew
Negative skewness values mean the distribution is skewed to the left.
References: https://docs.microsoft.com/en-us/azure/machine-learning/studio-module-reference/compute-elementary-statistics
Latest DP-100 Practice Questions with 227 Q&As
Updated Study Material | Instant Download | Detailed Answers and Explanations