Refer to the exhibit, which contains a screenshot of some phase 1 settings.
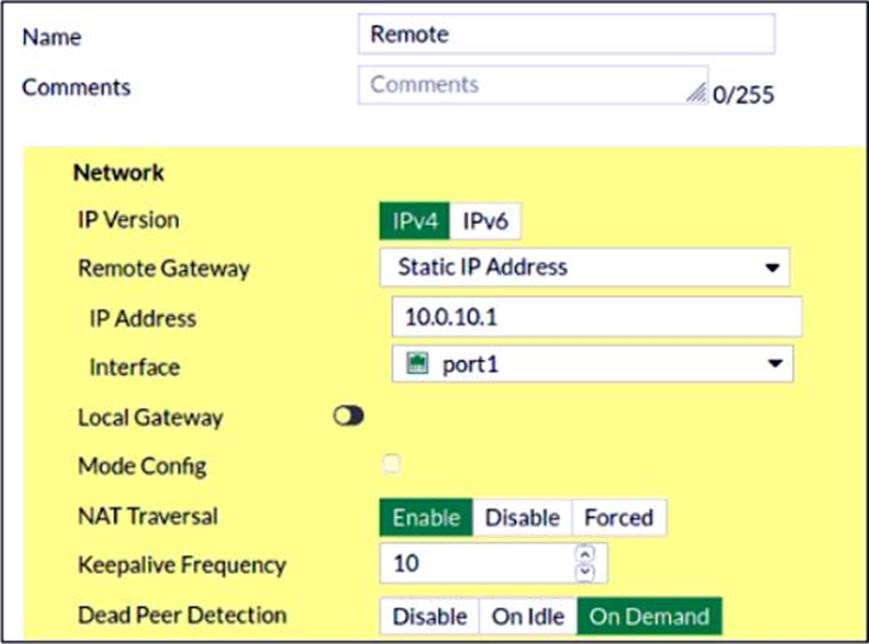
The VPN is not up. To diagnose the issue, the administrator enters the following CLI commands to an SSH session on FortiGate: diagnose vpn ike log-filter dst-addr4 10.0.10.1 diagnose debug application ike -1
However, the IKE real-time debug does not show any output.
Why?
A . The administrator must also run the command diagnose debug enable.
B. The administrator must enable the following real-time debug: diagnose debug application ipsec -1.
C. The log-filter setting is incorrect. The VPN traffic does not match this filter.
D. The debug shows only error messages. If there is no output, then the phase 1 and phase 2 configurations match.
Answer: A
Explanation:
https://community.fortinet.com/t5/FortiGate/Technical-Tip-IPSec-VPN-Diagnostics-Possible-reasons/ta-p/192006
Latest NSE7_EFW-7.0 Practice Questions with 115 Q&As
Updated Study Material | Instant Download | Detailed Answers and Explanations