DRAG DROP
You are configuring the Azure DevOps dashboard. The solution must meet the technical requirements.
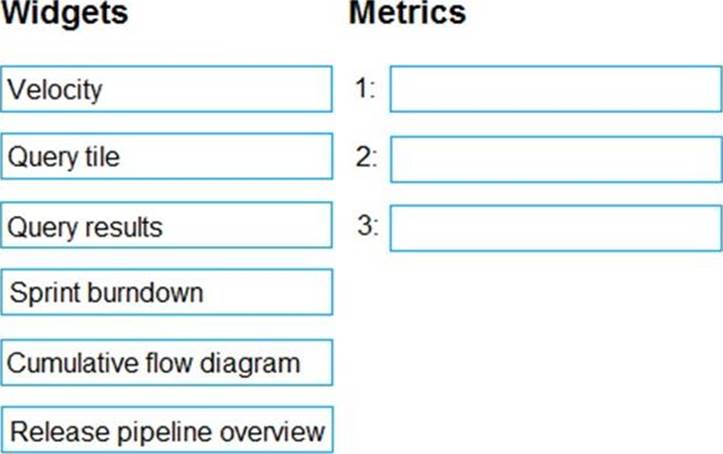
Which widget should you use for each metric? To answer, drag the appropriate widgets to the correct metrics. Each widget may be used once, more than once, or not at all. You may need to drag the split bar between panes or scroll to view content. NOTE: Each correct selection is worth one point.
Answer: 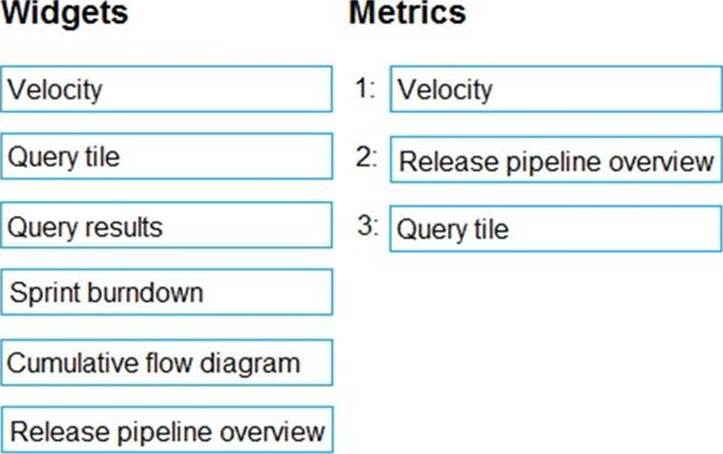
Explanation:
Graphical user interface, text, application
Description automatically generated
Woodgrove Bank identifies the following technical requirements:
✑ The Azure DevOps dashboard must display the metrics shown in the following table:
Box 1: Velocity
Velocity displays your team velocity. It shows what your team delivered as compared to plan.
Box 2: Release pipeline overview
Release pipeline overview shows the status of environments in a release definition.
Box 3: Query tile
Query tile displays the total number of results from a query.
Latest AZ-400 Practice Questions with 289 Q&As
Updated Study Material | Instant Download | Detailed Answers and Explanations