- All Exams Instant Download
What can you identify from the results?
You open a Power Bl Desktop report that contains an imported data model and a single report page.
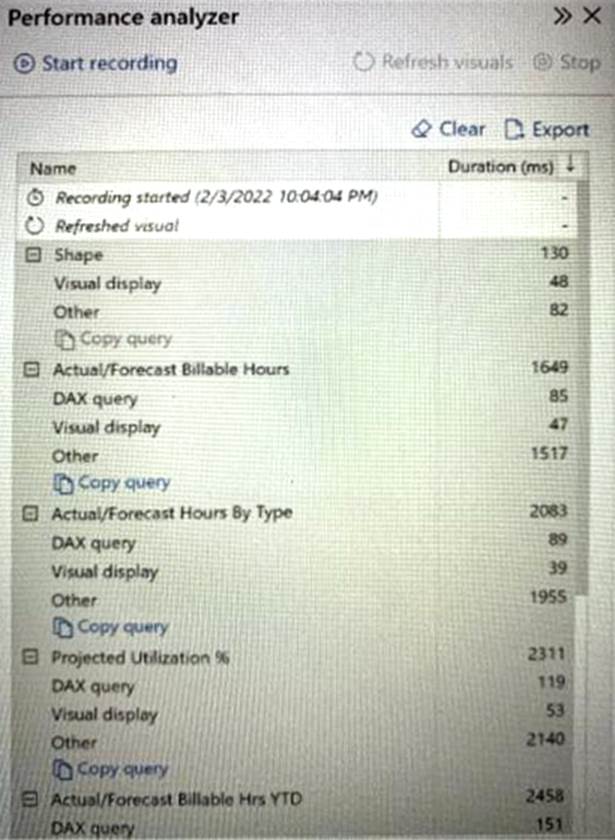
You open Performance analyzer, start recording, and refresh the visuals on the page.
The recording produces the results shown in the following exhibit

What can you identify from the results?
A . The Actual/Forecast Hours by Type visual takes a long time to render on the report page when the data is cross-filtered.
B. The Actual/Forecast Billable Hrs YTD visual displays the most data.
C. Unoptimized DAX queries cause the page to load slowly.
D. When all the visuals refresh simultaneously, the visuals spend most of the time waiting on other processes to finish.
Answer: D
Explanation:
Most time is spent in the category Other – time required by the visual for preparing queries, waiting for other visuals to complete, or performing other background processing.
Note: Each visual’s log information includes the time spent (duration) to complete the following categories of tasks:
DAX query – if a DAX query was required, this is the time between the visual sending the query, and for Analysis Services to return the results.
Visual display – time required for the visual to draw on the screen, including time required to retrieve any web images or geocoding.
Other – time required by the visual for preparing queries, waiting for other visuals to complete, or performing other background processing.
Reference: https://docs.microsoft.com/en-us/power-bi/create-reports/desktop-performance-analyzer
Latest DP-500 Dumps Valid Version with 83 Q&As
Latest And Valid Q&A | Instant Download | Once Fail, Full Refund
Subscribe
Login
0 Comments
Inline Feedbacks
View all comments

