Nash’s team just completed their first sprint.
What can they learn from this chart? (Choose three.)
(Assume Remaining Estimate and Time Spent is enabled for this board.)
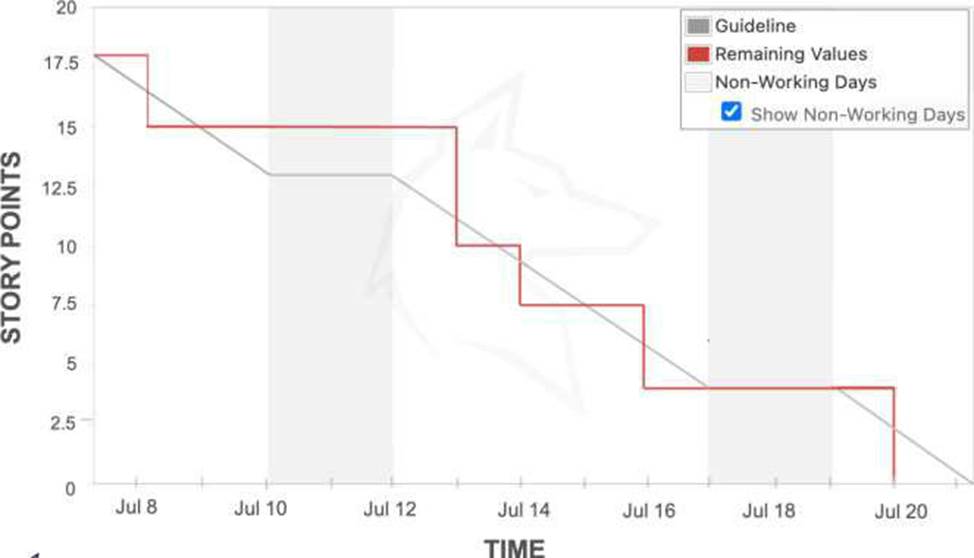
A . Some of the issues are resolved during non-working days.
B. Some of the issues are still unresolved.
C. This sprint ends with 0 story points.
D. This sprint starts with 20 story points.
E. There are issues worth 5 story points resolved on July 13th.
F. There are no scope changes in this sprint.
Answer: C,E,F
Explanation:
The grey area indicates non-working days. There were no issues resolved during non-working days since story points did not reduce in the grey area.
This chart starts drawing the Guideline and Remaining Values lines at the 18 story points on the y-axis.
On July 13th, story points were reduced from 15 to 10. This means that users have closed some issues that are worth 5 story points.
Users have closed all issues on July 20th. There are no story points remaining on this date.
Story points do not increase during this sprint. Since the Remaining Estimate and Time Spent is enabled for this board, scope change is indicated in the Burndown Chart for the subtask.
Latest ACP-620 Dumps Valid Version with 150 Q&As
Latest And Valid Q&A | Instant Download | Once Fail, Full Refund
