- All Exams Instant Download
HOTSPOT
You have a report page that contains the visuals shown in the following exhibit.
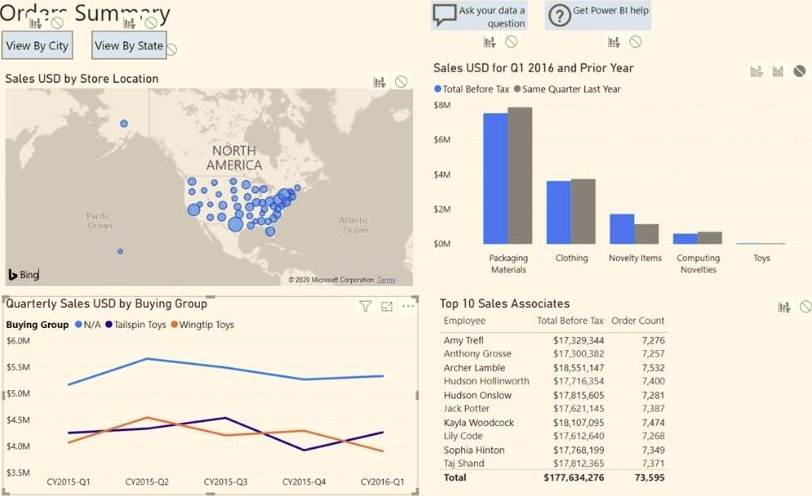
Use the drop-down menus to select the answer choice that completes each statement
based on the information presented in the graphic. NOTE: Each correct selection is worth one point.
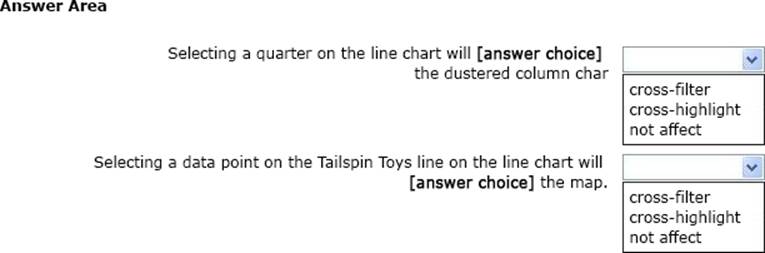
Answer: 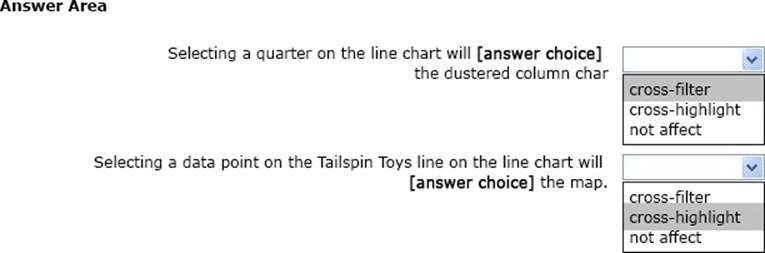
Explanation:
Box 1: cross-filter
By default, selecting a data point in one visual on a report page will cross-filter or cross-highlight the other visuals on the page.
Box 2: cross-highlight
Example:
By default, selecting a data point in one visual on a report page will cross-filter or cross-highlight the other visuals on the page.
Latest DA-100 Dumps Valid Version with 114 Q&As
Latest And Valid Q&A | Instant Download | Once Fail, Full Refund

selecting a quarter on a line chart will not affect cluster column chart because “none” is selected in the interactions