You have the visual shown in the exhibit. (Click the Exhibit tab.)
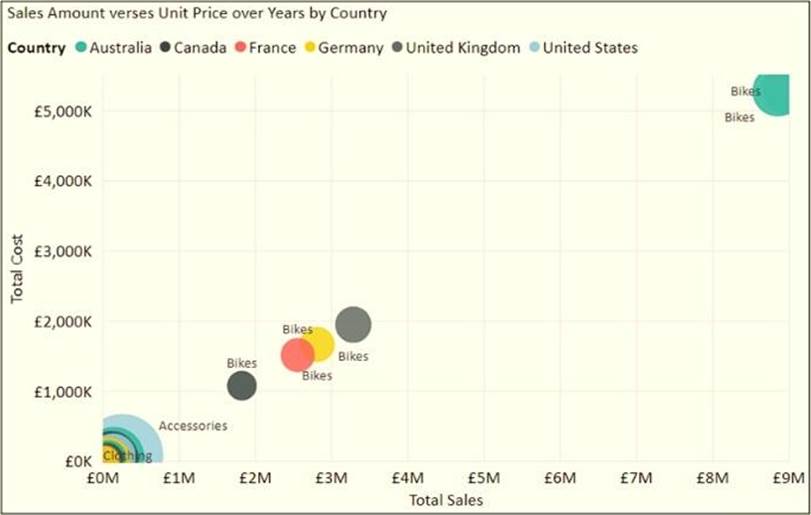
You need to show the relationship between Total Cost and Total Sales over time.
What should you do?
A . Add a play axis.
B . Add a slicer for the year.
C . From the Analytics pane, add an Average line.
D . Create a DAX measure that calculates year-over-year growth.
Answer: A
Latest DA-100 Dumps Valid Version with 114 Q&As
Latest And Valid Q&A | Instant Download | Once Fail, Full Refund
