HOTSPOT
You need to create a visual as shown in the following exhibit.
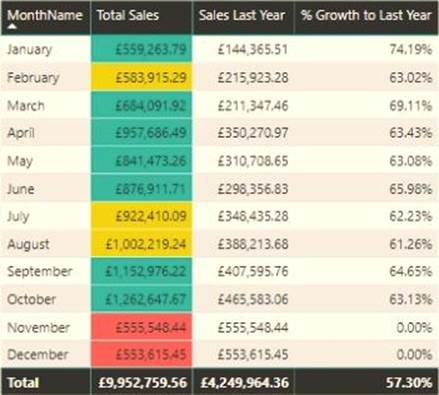
The indicator color for Total Sales will be based on % Growth to Last Year.
The solution must use the existing calculations only.
How should you configure the visual? To answer, select the appropriate options in the answer area. NOTE: Each correct selection is worth one point.
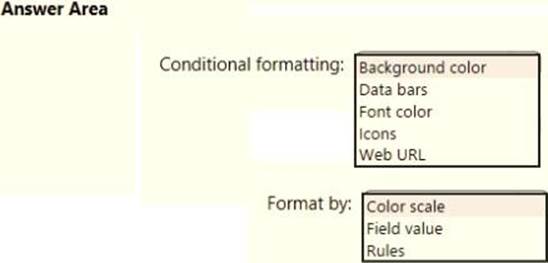
Answer: 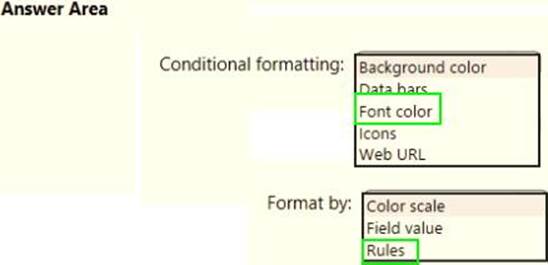
Latest DA-100 Dumps Valid Version with 114 Q&As
Latest And Valid Q&A | Instant Download | Once Fail, Full Refund
