HOTSPOT
You have a Power BI report.
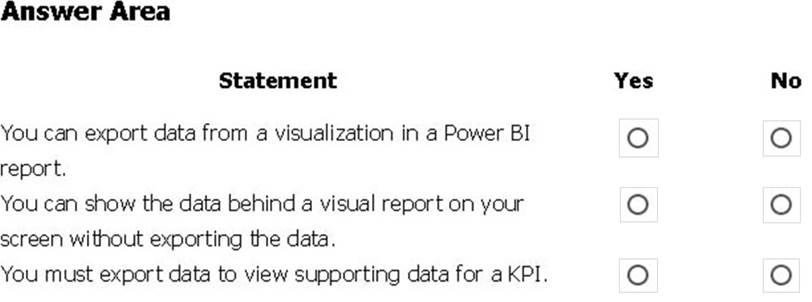
For each of the following statements, select Yes if the statement is true. Otherwise, select No . NOTE: Each correct selection is worth one point.
Answer: 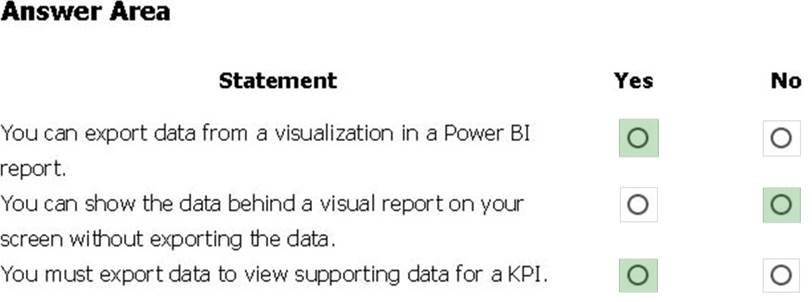
Explanation:
Box 1: Yes
If you’d like to see the data that Power BI uses to create a visualization, you can display that data in Power BI. You can also export that data to Excel as an .xlsx or .csv file. The option to export the data requires a Pro or Premium license and edit permissions to the dataset and report.
Note: Export data from a Power BI dashboard
Box 2: No
Underlying data: Select this option if you want to see the data in the visual and additional data from the model (see chart below for details). If your visualization has an aggregate, selecting Underlying data removes the aggregate. When you select Export, Power BI exports the data to an
.xlsx file and your browser prompts you to save the file. Once saved, open the file in Excel.
Box 3: Yes
A KPI dataset needs to contain goal values for a KPI. If your dataset doesn’t contain goal values, you can create them by adding an Excel sheet with goals to your data model or PBIX file.
Note: A Key Performance Indicator (KPI) is a visual cue that communicates the amount of progress made toward a measurable goal.
Reference:
https://docs.microsoft.com/en-us/power-bi/visuals/power-bi-visualization-export-data
https://docs.microsoft.com/en-us/power-bi/visuals/power-bi-visualization-kpi
Latest PL-900 Practice Questions with 171 Q&As
Updated Study Material | Instant Download | Detailed Answers and Explanations