- All Exams Instant Download
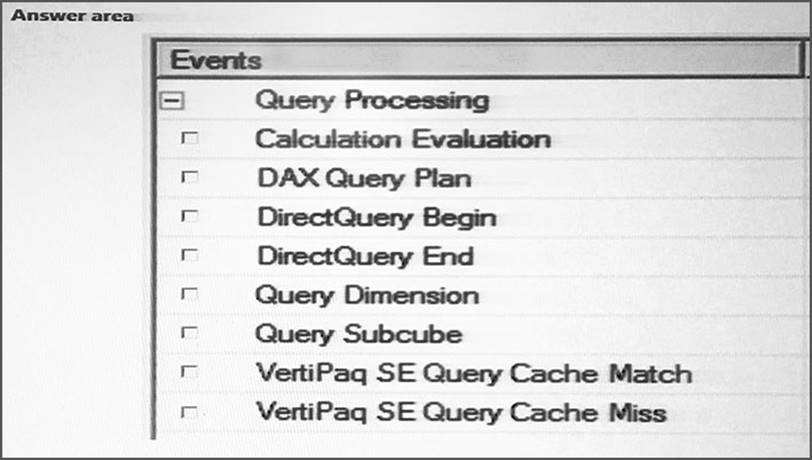
Which three event should you monitor on the SQL Server Profiler trace events configuration page?
HOTSPOT
A database named DB2 uses the InMemory query mode. Users frequently run the following query:

You need to configure SQL Server Profiler to determine why the query is performing poorly.
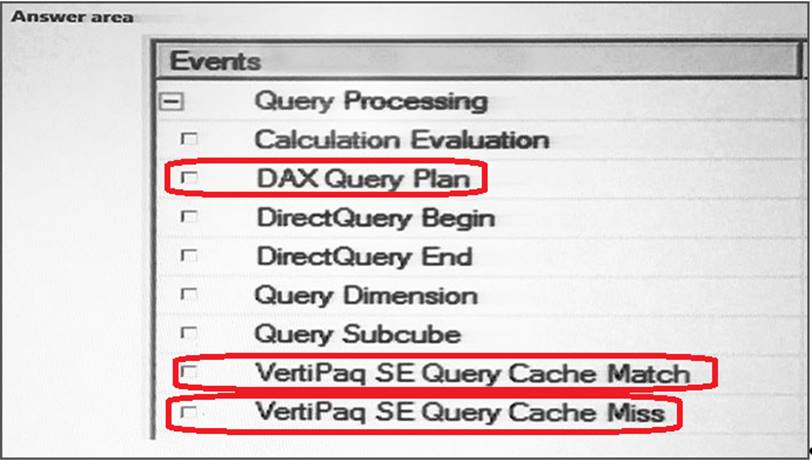
Which three event should you monitor on the SQL Server Profiler trace events configuration page? To answer, select the appropriate options in the answer area.

Answer: 
Explanation:
By using SQL Profiler, you can intercept two classes of trace events from Analysis Services, DAX Query Plan and DirectQuery events, both generated by the DirectQuery engine. Here, in this scenario we have a DAX Query.
DAX Query Plan events are generated by the DAX formula.
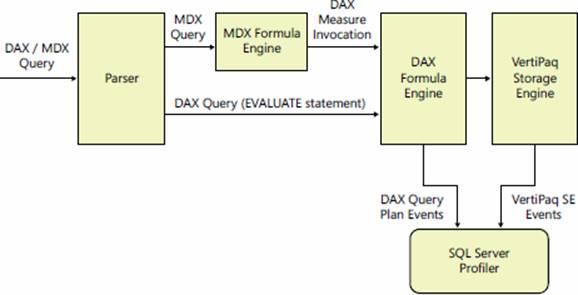
By using the In-Memory mode, you store a copy of data in the xVelocity (VertiPaq) storage engine.
Figure: This is how a query is executed by using In-Memory mode.

References: Microsoft SQL Server 2012 Analysis Services, The BISM Tabular Model, Microsoft Press (July 2012), page 331
From Scenario: Users report that the query takes a long time to complete.
Subscribe
Login
0 Comments
Inline Feedbacks
View all comments

