Which of the following chart type makes use of ‘binned’ data?
A . Gantt Chart
B . Bullet chart
C . Histogram
D . Treemaps
Answer: C
Explanation:
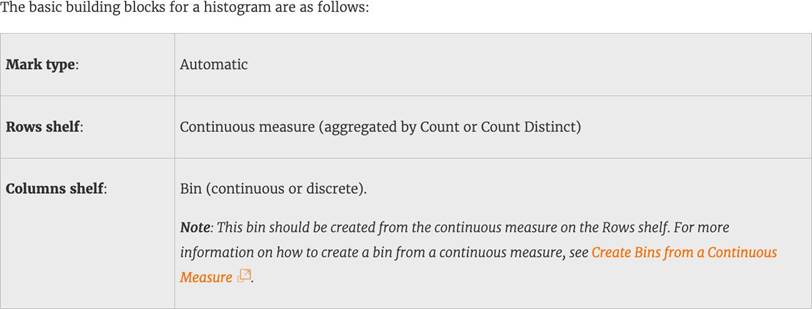
A histogram is a chart that displays the shape of a distribution. A histogram looks like a bar chart but groups values for a continuous measure into ranges, or bins.
Reference: https://help.tableau.com/current/pro/desktop/enus/buildexamples_histogram.htm
Latest Desktop Specialist Dumps Valid Version with 151 Q&As
Latest And Valid Q&A | Instant Download | Once Fail, Full Refund
