Using the dataset, create a bar chart showing the average Quantity broken down by Region, and filtered by Country to only show Japan.
What was the average Quantity in the State of Tokyo?
A . 3.000
B . 3.840
C . 3.704
D . 3.500
Answer: C
Explanation:
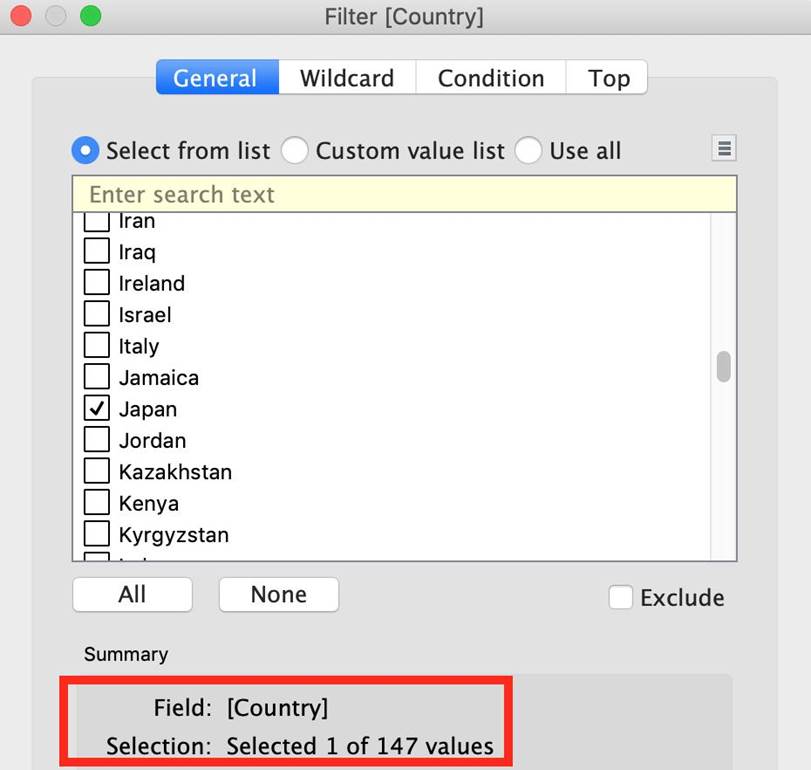
Explanation Since we need to focus on 1 country -> Japan, let’s filter on it first as follows:
1) Drag Country to the filter shelf, and choose only Japan. Click OK.
2) Read the Question Carefully, we need to break down the visualisation by Region, then by Country, and then by State. So let’s do that: Drag Region to the column shelf, followed by Country. Drill down into Country to include states as well. Then drag Quantity to the Row Shelf, and change the Aggregation to AVERAGE.
The following is our visualisation:
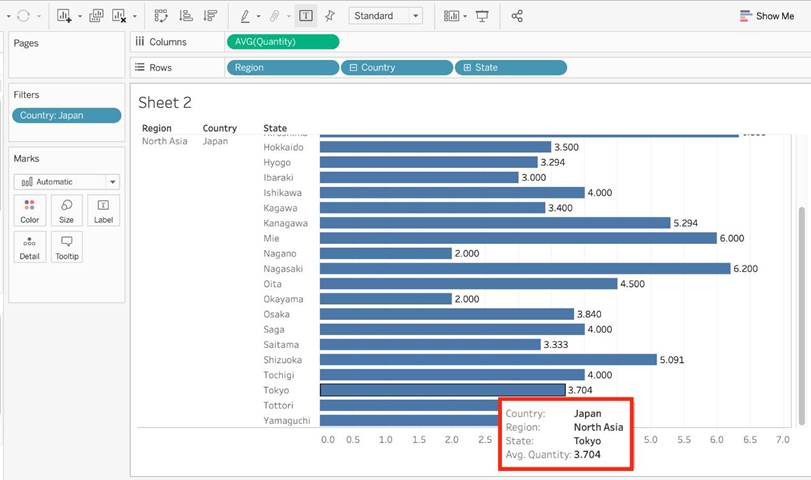
Now that you think of it, EVEN IF YOU REMOVE THE REGION, THE ANSWER REMAINS THE SAME. Such elements will be present in the actual exam too, just to make the question sound a little difficult, but actually it is pretty straightforward 🙂
Latest Desktop Specialist Dumps Valid Version with 151 Q&As
Latest And Valid Q&A | Instant Download | Once Fail, Full Refund
