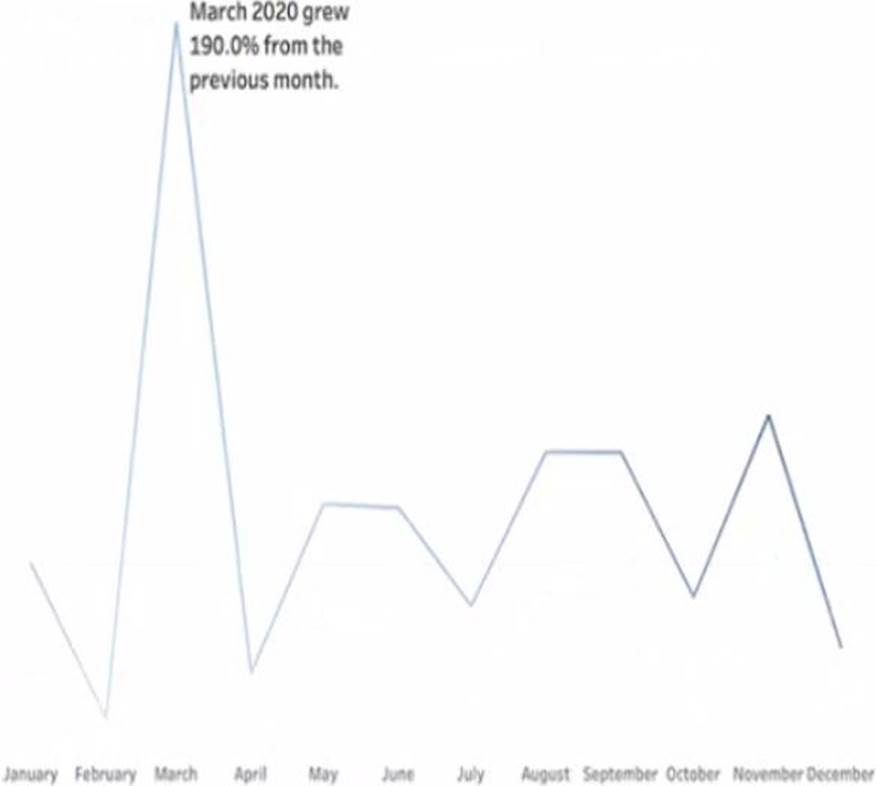
You have a line chart on a worksheet.
You want to add a comment to March 2020 as shown in the following visualization.
What should you do?
A . Drag the growth rate to Text on the Marks card
B. Enable captions
C. Annotate March 2020
D. Add a tooltip
Answer: C
Explanation:
To add a comment to March 2020 on a line chart, you need to annotate that mark. You can right-click on the mark and select Annotate > Mark from the menu. This will open a dialog box where you can type your comment and format it as you like. You can also drag and drop the annotation to position it on the worksheet. Dragging the growth rate to Text on the Marks card will add a label to every mark on the line chart, enabling captions will show a description of the worksheet at the bottom, and adding a tooltip will show a text box when users hover over a mark.
Reference:
https://help.tableau.com/current/pro/desktop/en-us/formatting_annotations.htm
https://help.tableau.com/current/pro/desktop/en-us/formatting_annotations_create.htm
Latest TDA-C01 Practice Questions with 55 Q&As
Updated Study Material | Instant Download | Detailed Answers and Explanations