You have a database that includes field named sales, City and Region.
You have the following chart that shows the number of sales made in different cities.
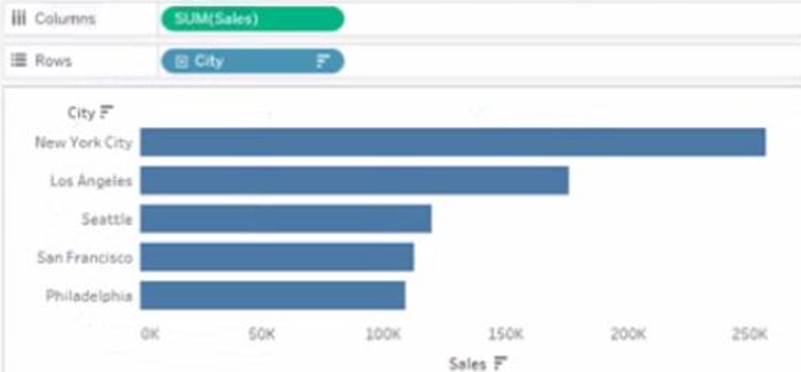
You want to dynamically show the corresponding region when users hover their mouse over any of the bars.
What should you do?
A . Right-click a in the chat, select Annotate and then select Mark.
B. Right-click a bar in the chart select Mark Label and then select Always show.
C. Edit the aliases for City.
D. Drag Region to Tooltip on the Marks card
Answer: D
Explanation:
To show the corresponding region when users hover their mouse over any of the bars, you need to drag Region to Tooltip on the Marks card. This will add Region as a field in the tooltip text that appears when users hover over a mark. You can also customize the tooltip text by editing it in the Tooltip dialog box.
Reference:
https://help.tableau.com/current/pro/desktop/en-us/buildmanual_shelves.htm
https://help.tableau.com/current/pro/desktop/en-us/formatting_tooltips.htm
Latest TDA-C01 Practice Questions with 55 Q&As
Updated Study Material | Instant Download | Detailed Answers and Explanations