You have the visual shown in the Original exhibit. (Click the Original tab.)
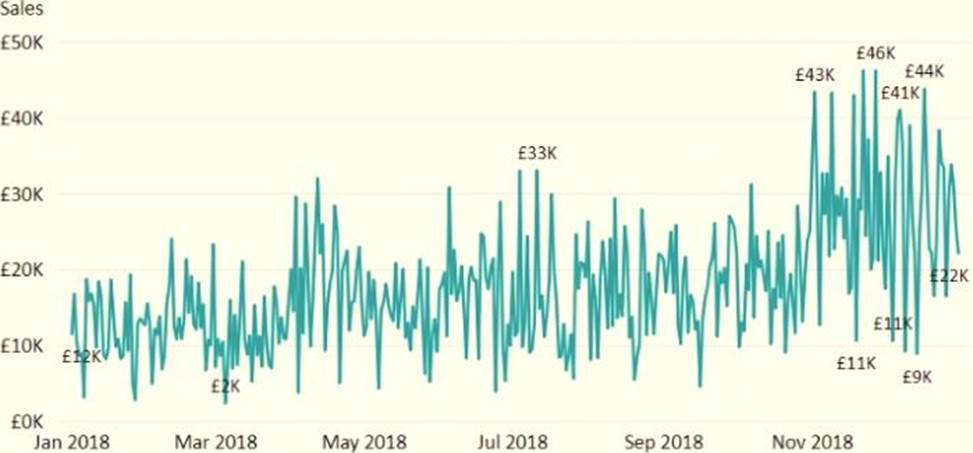
You need to configure the visual as shown in the Modified exhibit. (Click the Modified tab.)
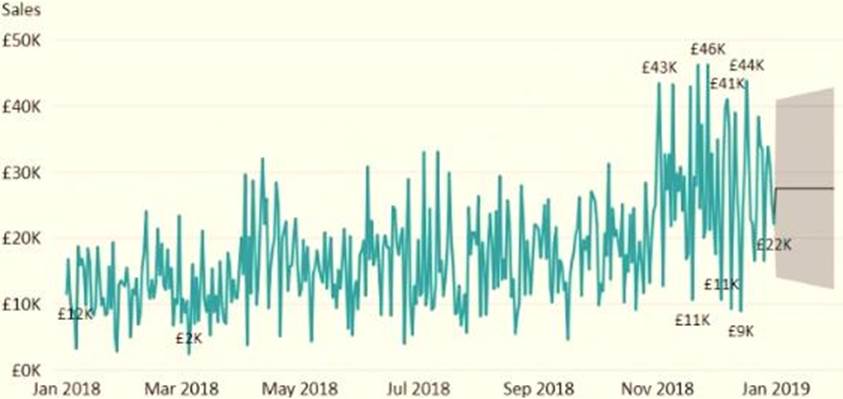
What should you add to the visual?
A . a measure
B . a trendline
C . a forecast
D . an Average line
Answer: C
Explanation:
Explore forecast results by adjusting the desired confidence interval or by adjusting outlier data to see how they affect results.
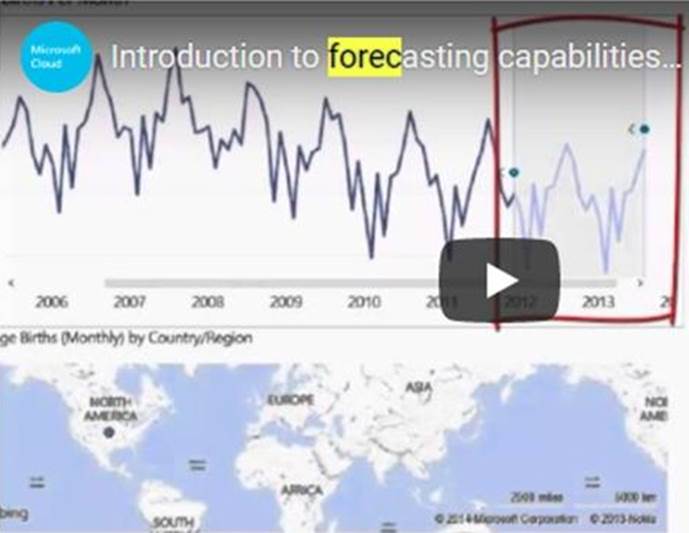
Reference: https://powerbi.microsoft.com/fr-fr/blog/introducing-new-forecasting-capabilities-in-power-view-for-office-365/
Latest PL-300 Practice Questions with 131 Q&As
Updated Study Material | Instant Download | Detailed Answers and Explanations