Refer to the following exhibit:
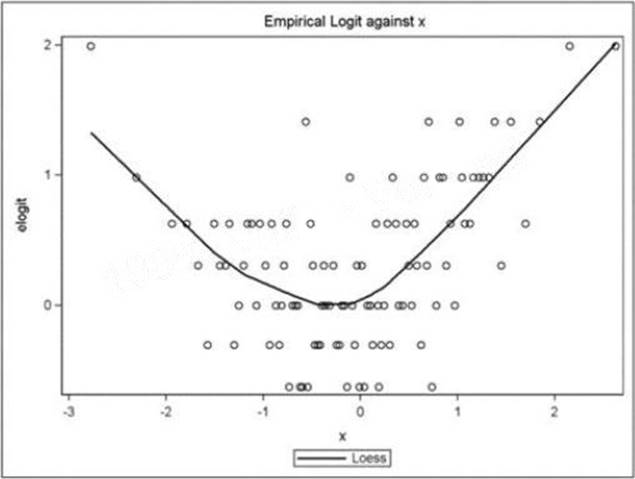
What is a correct interpretation of this graph?
A . The association between the continuous predictor and the binary response is quadratic.
B . The association between the continuous predictor and the log-odds is quadratic.
C . The association between the continuous predictor and the continuous response is quadratic.
D . The association between the binary predictor and the log-odds is quadratic.
Answer: B
Latest A00-240 Practice Questions with 99 Q&As
Updated Study Material | Instant Download | Detailed Answers and Explanations