Open the link to Book1 found on the desktop. Open the Line worksheet.
Modify the chart to show only main and max values of both measures in each region.
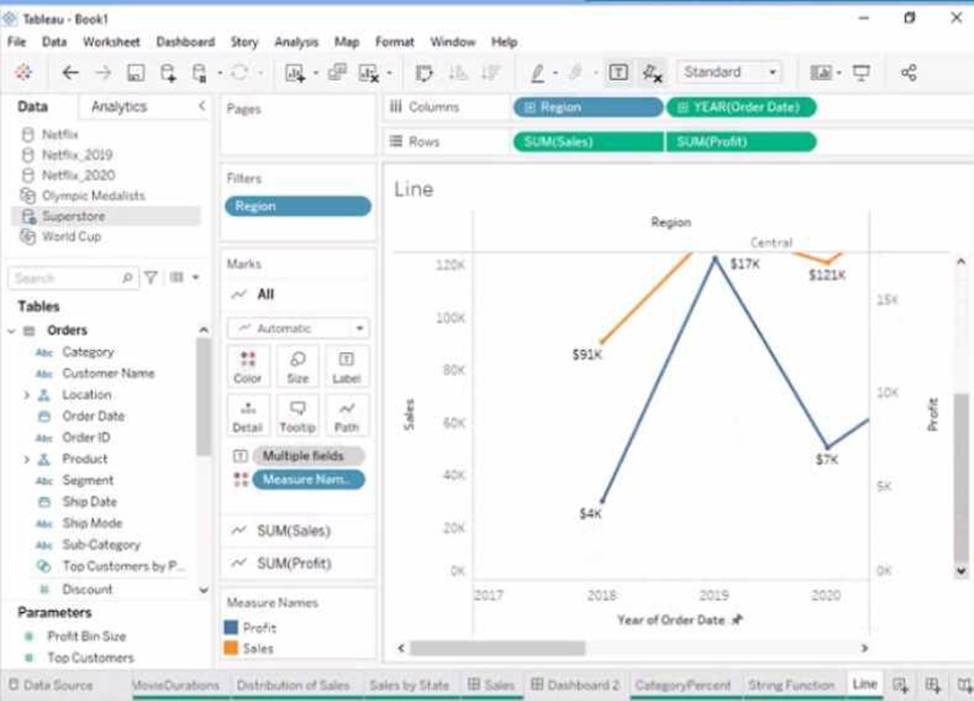
Answer: To modify the chart to show only min and max values of both measures in each region, you need to do the following steps:
Open the link to Book1 found on the desktop. This will open the Tableau workbook that contains the Line worksheet.
Click on the Line tab at the bottom of the workbook to open the worksheet. You will see a line chart that shows the sales and profit for each month by region.
Drag Month from the Columns shelf to Filters shelf. This will open a dialog box that allows you to filter by different criteria.
Select Range of Dates from the dialog box. This will show you options to filter by a range of dates or values.
Select Minimum and Maximum from the drop-down list next to Month. This will filter by the minimum and maximum values of Month for each region. You can also enter specific values or use the sliders to adjust the range.
Click OK to apply the filter. You will see that the line chart now shows only min and max values of both measures in each region.
Reference:
https://help.tableau.com/current/pro/desktop/en-us/filtering.htm
https://help.tableau.com/current/pro/desktop/en-us/filtering_range.htm
Latest TDA-C01 Practice Questions with 55 Q&As
Updated Study Material | Instant Download | Detailed Answers and Explanations