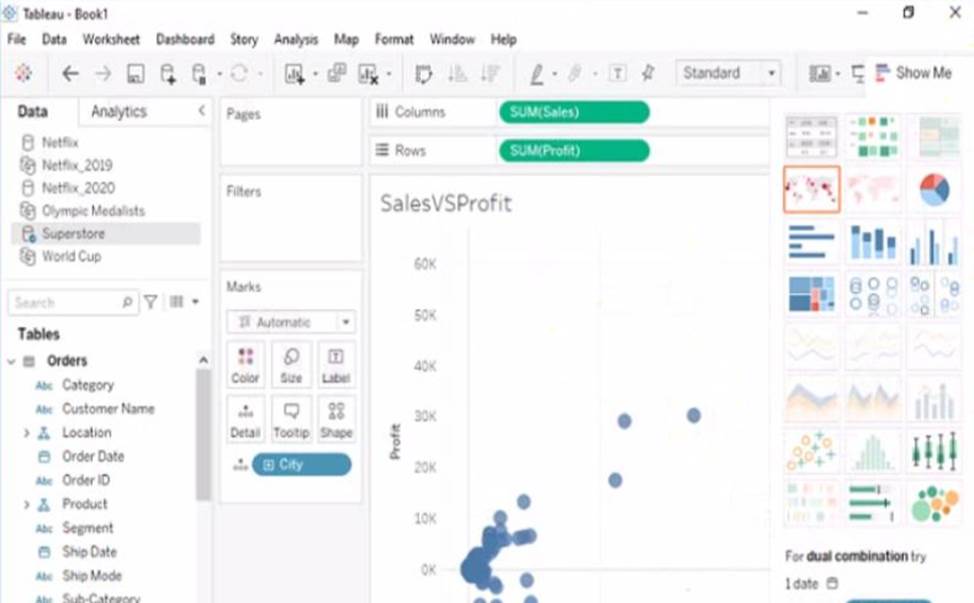
Open the link to Book1 found on the desktop. Open SalesVSProfit worksheet.
Add a distribution band on Profit to show the standard deviation from- 1 to 1.
Answer: To add a distribution band on Profit to show the standard deviation from -1 to 1, you need to do the following steps:
Open the link to Book1 found on the desktop. This will open the Tableau workbook that contains the SalesVSProfit worksheet.
Click on the SalesVSProfit tab at the bottom of the workbook to open the worksheet. You will see a scatter plot that shows the relationship between Sales and Profit for each Sub-Category.
Click on the Analytics tab on the left side of the workbook to open the Analytics pane. You will see a list of analytical objects that you can drag and drop onto your worksheet.
Drag Distribution Band from the Analytics pane to Profit on the Rows shelf. This will add a distribution band on Profit that shows the average and confidence interval for each Sub-Category. Click on the Edit button on the distribution band to open the Edit Distribution Band dialog box. You will see options to customize your distribution band.
Change the Band From value to -1 and the Band To value to 1. This will change the distribution band to show the standard deviation from -1 to 1, which means one standard deviation below and above the average.
Click OK to apply the changes. You will see that the distribution band now shows a narrower range of values for Profit.
Reference:
https://help.tableau.com/current/pro/desktop/en-us/analytics.htm
https://help.tableau.com/current/pro/desktop/en-us/analytics_distributionband.htm
https://help.tableau.com/current/pro/desktop/en-us/analytics_distributionband_edit.htm
Latest TDA-C01 Practice Questions with 55 Q&As
Updated Study Material | Instant Download | Detailed Answers and Explanations