HOTSPOT
You are creating a Power Bl Desktop report.
You add a Python visual to the report page.
You plan to create a scatter chart to visualize the data.
You add Python code to the Python script editor.
You need to create the scatter chart.
How should you complete the Python code? To answer, select the appropriate options in the answer area. NOTE: Each correct selection is worth one point.
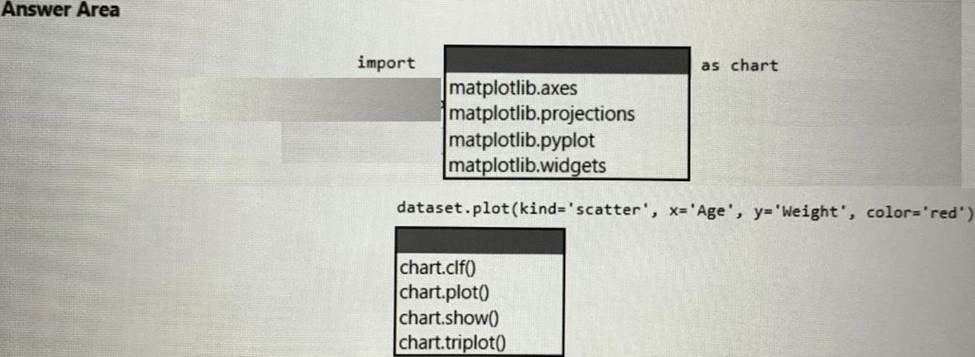
Answer: 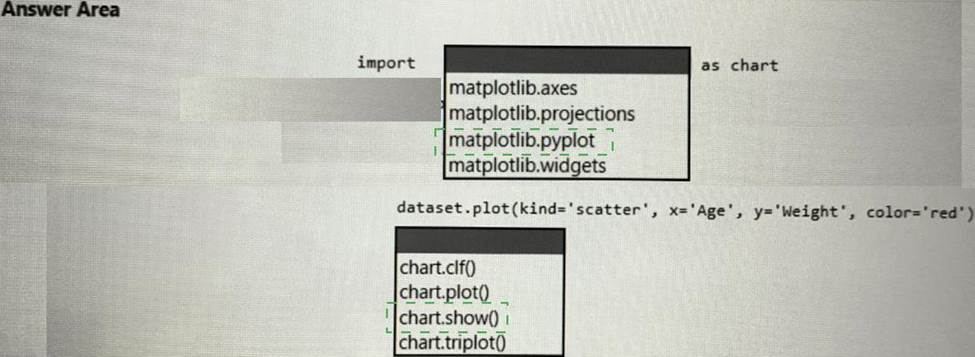
Explanation:
Box 1: matplotlib.pyplot
Create a scatter plot
Let’s create a scatter plot to see if there’s a correlation between age and weight.
Under Paste or type your script code here, enter this code:
import matplotlib.pyplot as plt
dataset.plot(kind=’scatter’, x=’Age’, y=’Weight’, color=’red’)
plt.show()
Box 2: chart.show()
Reference: https://docs.microsoft.com/en-us/power-bi/connect-data/desktop-python-visuals#create-a-scatter-plot
Latest DP-500 Practice Questions with 83 Q&As
Updated Study Material | Instant Download | Detailed Answers and Explanations