
You have the following Python code in an Apache Spark notebook.
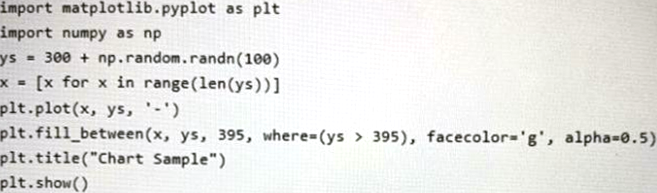
Which type of chart will the code produce?
A . a stacked bar chart
B . a pie chart
C . a bar chart
D . an area chart
Answer: D
Explanation:
The matplotlib.pyplot.fill_between function fills the area between two horizontal curves.
The curves are defined by the points (x, y1) and (x, y2). This creates one or multiple polygons describing the filled area.
Reference: https://matplotlib.org/3.5.0/api/_as_gen/matplotlib.pyplot.fill_between.html
Latest DP-500 Practice Questions with 83 Q&As
Updated Study Material | Instant Download | Detailed Answers and Explanations