HOTSPOT
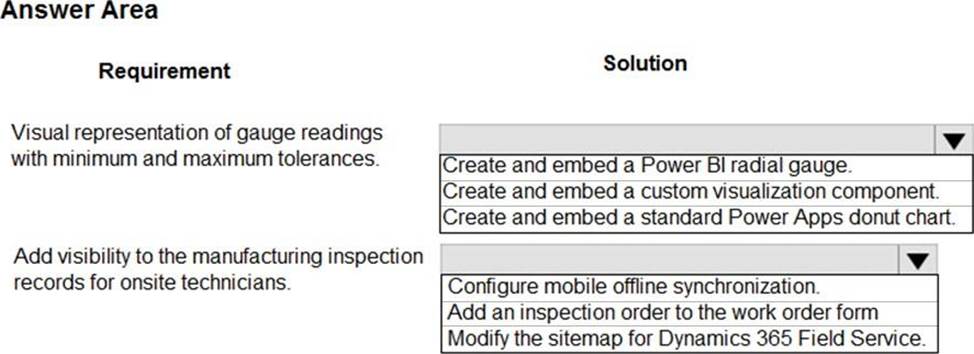
You need to recommend a solution to meet user interface requirements.
What should you recommend? To answer, select the appropriate options in the answer area. NOTE: Each correct selection is worth one point.
Answer: 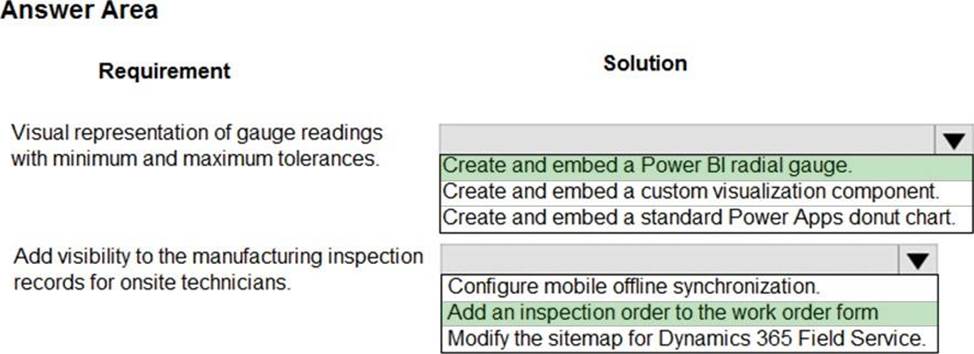
Explanation:
Box 1: Create and embed a Power Bi radial gauge
A radial gauge chart has a circular arc and shows a single value that measures progress toward a goal or a Key Performance Indicator (KPI). The line (or needle) represents the goal or target value. The shading represents the progress toward that goal. The value inside the arc represents the progress value. Power BI spreads all possible values evenly along the arc, from the minimum (left-most value) to the maximum (right-most value).
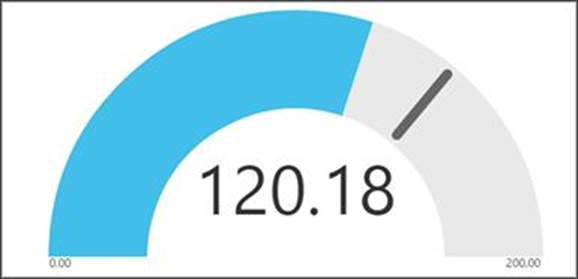
In this example, you’re a car retailer tracking the sales team’s average sales per month. The needle represents a 140 cars sales goal. The minimum possible average sales is 0 and the maximum is 200. The blue shading shows that the team is averaging approximately 120 sales this month.
Box 2: Add an inspection order to the work order form
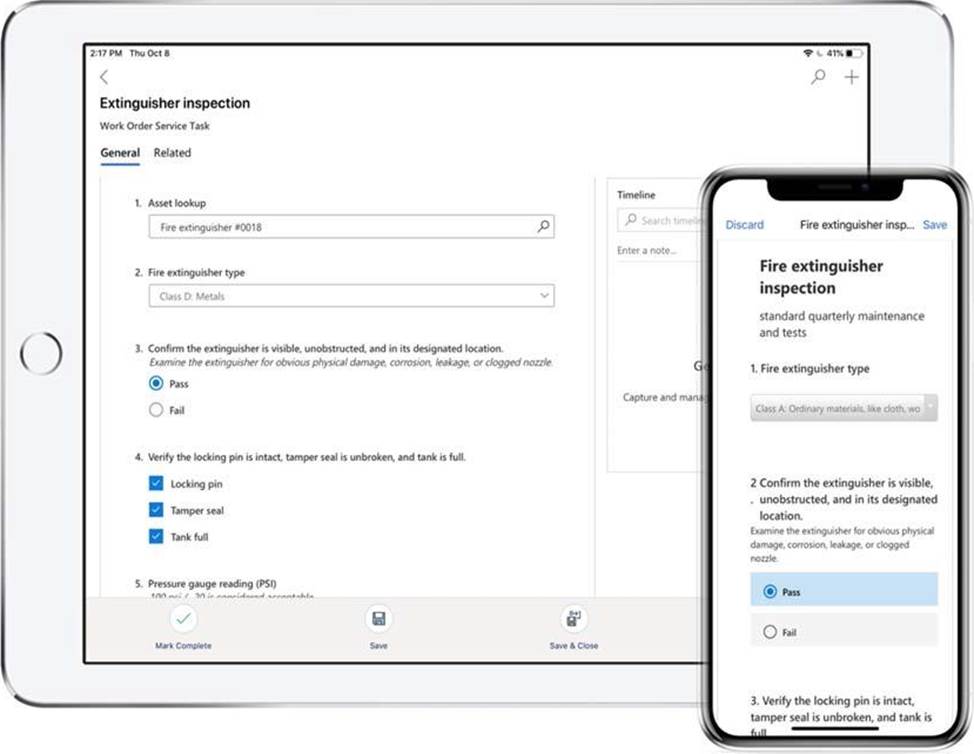
You can add inspections to work orders in Dynamics 365 Field Service.
Field Service inspections are digital forms that technicians use to quickly and easily answer a list of questions as part of a work order. The list of questions can include safety protocols, pass-and-fail tests for a customer asset, an interview with a customer, or other audits and assessments performed before, during, or after a work order.
Example:
Latest PL-600 Practice Questions with 47 Q&As
Updated Study Material | Instant Download | Detailed Answers and Explanations