
You have the visual shown in the exhibit. (Click the Exhibit tab.)
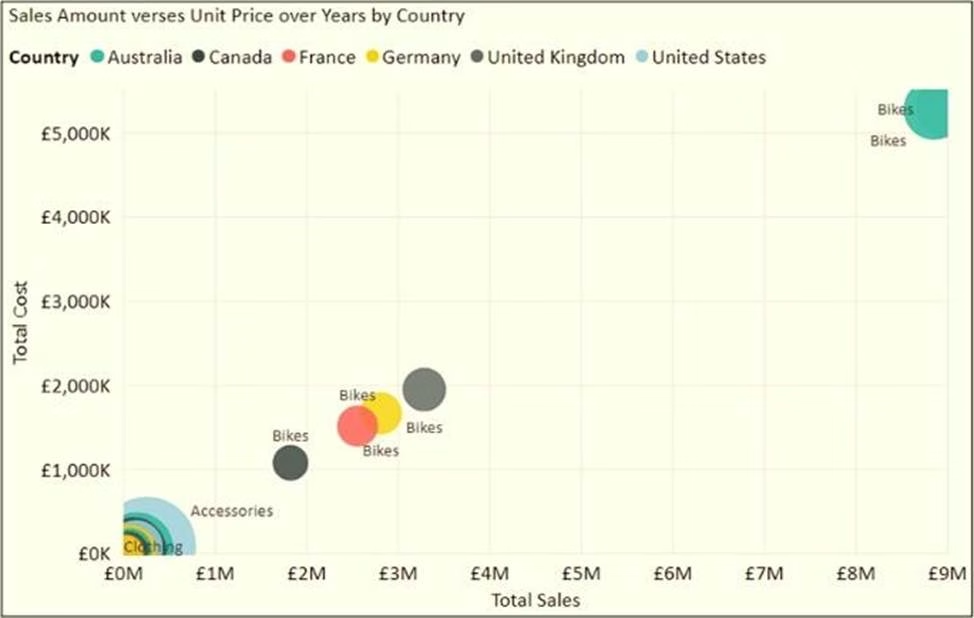
You need to show the relationship between Total Cost and Total Sales over time.
What should you do?
A . Add a play axis.
B . Add a slicer for the year.
C . From the Analytics pane, add an Average line.
D . Create a DAX measure that calculates year-over-year growth.
Answer: A
Explanation:
You can set up a date field in play axis, and then scatter chart will animate how measure values are compared to each other in each point of a time.
Reference: https://radacad.com/storytelling-with-power-bi-scatter-chart
Latest PL-300 Practice Questions with 131 Q&As
Updated Study Material | Instant Download | Detailed Answers and Explanations