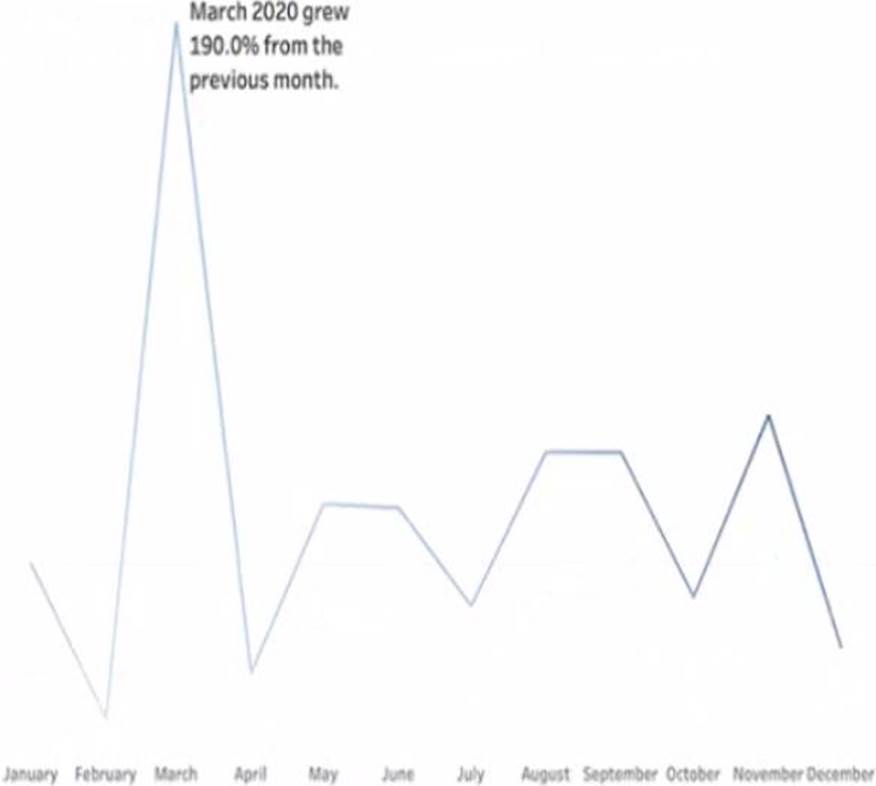
You have a line chart on a worksheet.
You want to add a comment to March 2020 as shown in the following visualization.
What should you do?
A . Drag the growth rate to Text on the Marks card
B. Enable captions
C. Annotate March 2020
D. Add a tooltip
Answer: D
Latest TDA-C01 Practice Questions with 55 Q&As
Updated Study Material | Instant Download | Detailed Answers and Explanations