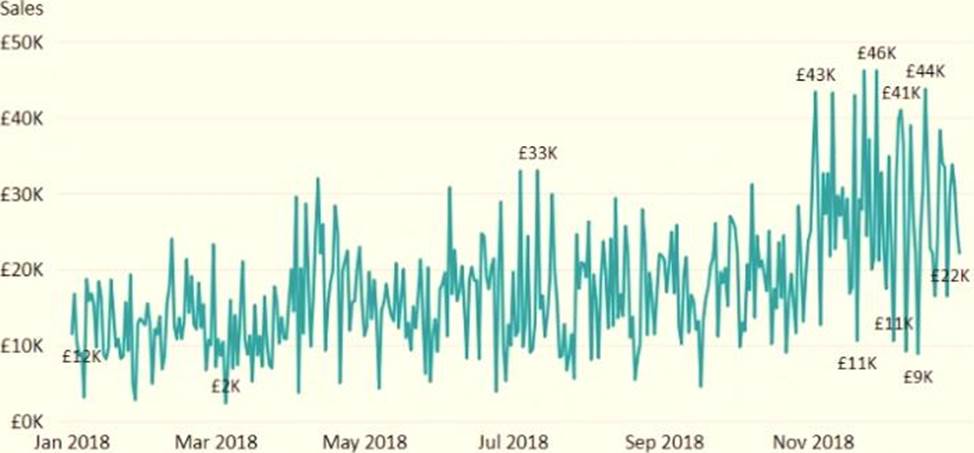
You have the visual shown in the Original exhibit. {Click the Original tab.)
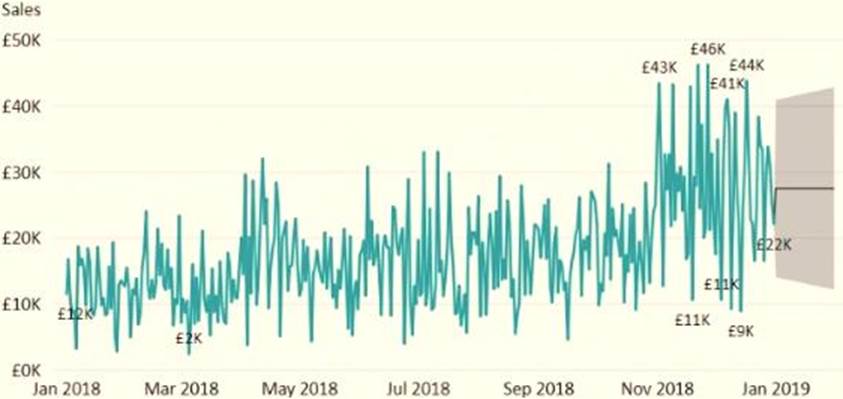
You need to configure the visual as shown in the Modified exhibit. (Click the Modified tab.)
What should you add to the visual?
A . a measure
B . a trendline
C . a forecast
D . an Average line
Answer: C
Explanation:
Explore forecast results by adjusting the desired confidence interval or by adjusting outlier data to see how they affect results.
Timeline
Description automatically generated with low confidence
Reference: https://powerbi.microsoft.com/fr-fr/blog/introducing-new-forecasting-capabilities-in-power-view-for-office-365/
Latest PL-300 Dumps Valid Version with 131 Q&As
Latest And Valid Q&A | Instant Download | Once Fail, Full Refund
