Microsoft DP-500 Designing and Implementing Enterprise-Scale Analytics Solutions Using Microsoft Azure and Microsoft Power BI Online Training
Microsoft DP-500 Online Training
The questions for DP-500 were last updated at Jul 16,2026.
- Exam Code: DP-500
- Exam Name: Designing and Implementing Enterprise-Scale Analytics Solutions Using Microsoft Azure and Microsoft Power BI
- Certification Provider: Microsoft
- Latest update: Jul 16,2026
DRAG DROP
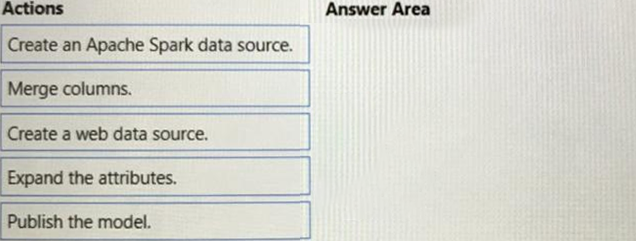
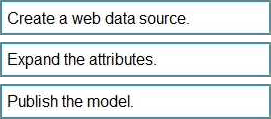
You need to integrate the external data source to support the planned changes.
Which three actions should you perform in sequence? To answer, move the appropriate actions from the list of actions to the answer area and arrange them in the correct order.
DRAG DROP
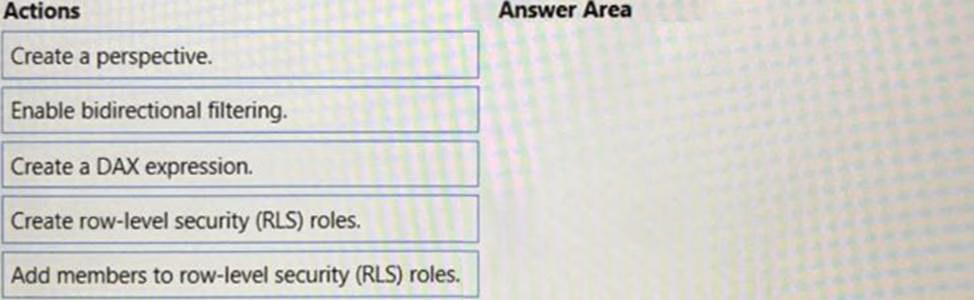
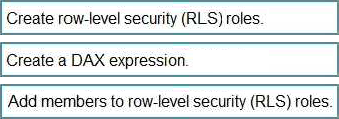
You need to create Power BI reports that will display data based on the customers’ subscription level.
Which three actions should you perform in sequence? To answer, move the appropriate actions from the list of actions to the answer area and arrange them in the correct order.
You need to identify the root cause of the data refresh issue.
What should you use?
- A . the Usage Metrics Report in powerbi.com
- B . Query Diagnostics in Power Query Editor
- C . Performance analyzer in Power Bl Desktop
Which two possible tools can you use to identify what causes the report to render slowly? Each correct answer presents a complete solution. NOTE: Each correct selection is worth one point.
- A . Synapse Studio
- B . DAX Studio
- C . Azure Data Studio
- D . Performance analyzer in Power Bl Desktop
You need to recommend a solution to resolve the query issue of the serverless SQL pool. The solution must minimize impact on the users.
What should you in the recommendation?
- A . Update the statistics for the serverless SQL pool.
- B . Move the data from the serverless SQL pool to a dedicated Apache Spark pool.
- C . Execute the sp_sec_process_daca_limic stored procedure for the serverless SQL pool.
- D . Move the data from the serverless SQL pool to a dedicated SQL pool.
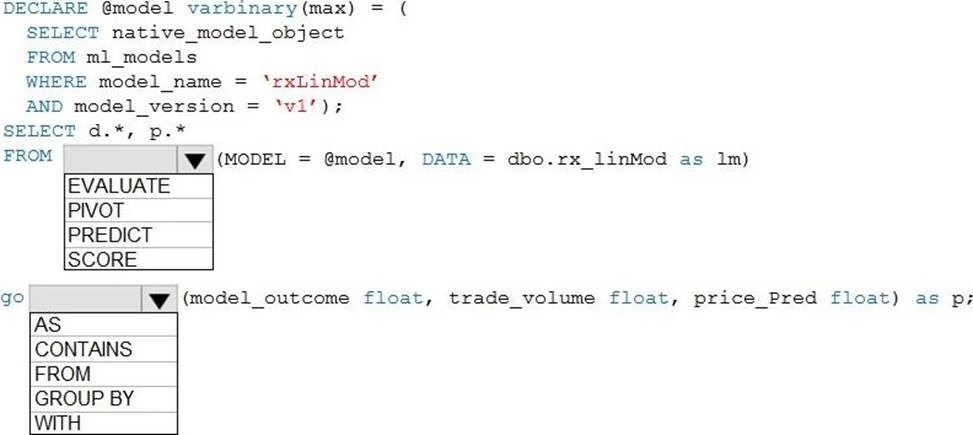
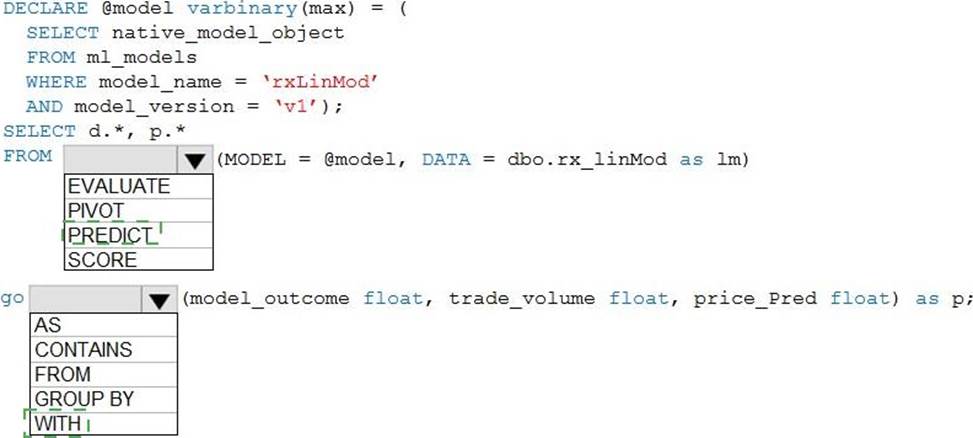
HOTSPOT
You need to build a Transact-SQL query to implement the planned changes for the internal users.
How should you complete the Transact-SQL query? To answer, select the appropriate options in the answer area. NOTE: Each correct selection is worth one point.
Topic 3, Fabrikam, Inc.
Overview
Fabrikam, Inc. is a software company that develops educational software for higher education.
Fabrikam has the following business units:
• Finance and Accounting
• Sales and Marketing
• Operations
• Product
The Product business unit contains the following groups:
• User experience designers
• Software engineers
• Product managers
• Testers
The Operations business unit contains an information technology (IT) group. The IT group contains an enterprise analytics team and an information security team.
Fabrikam has three Azure Synapse Analytics workspaces named workspace! prod, workspace 1 test, and workspaceldev. Each workspace is connected to an Azure Data Lake Storage account and contains a lake database that is accessed by using the built-in serverless SQL pool. The data in the Data Lake Storage accounts is available in the lake databases for analysts from every business unit to query and analyze by using Power Bl.
The company imports the following files into the Data Lake Storage accounts:
• User experience data stored as JSON files
• Finance data stored as CSV files
• Sales data stored as CSV files
Fabrikam has a Power Bl tenant that contains 30 workspaces in Pro license mode. The data in the workspaces is a mix of Import and DirectQuery datasets. All reports are interactive.
Fabrikam has three frequently used workspaces as shown in the following table.
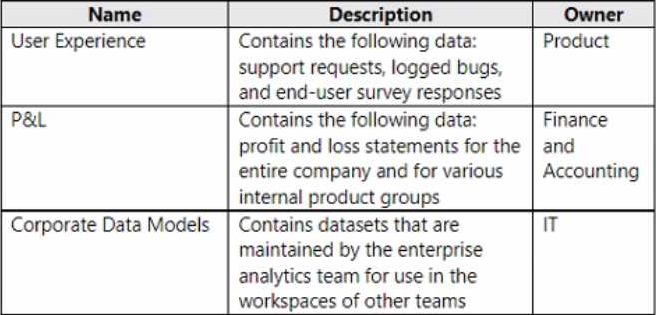
The Corporate Data Models workspace contains a dataset named Financial Model that is used by reports in the P&L workspace. Financial Model is maintained by the enterprise analytics team. The Corporate Data Models workspace and the User Experience workspace have corresponding development and test workspaces.
Administrators report an increase in the maintenance of Power Bl tenant assets due to analysts in the Finance and Accounting business unit who create new Power Bl datasets when the existing datasets already meet their needs.
Analysts in the Product business unit report the following issues:
• Datasets are published to the User Experience workspace, while the data sources reference workspace! test.
• The parsing of user experience data in Power Query is very slow.
The enterprise analytics team identifies two DAX measures in the Financial Model dataset that are consistently slow to execute. The team must identify all the reports that use the Financial Model dataset and notify the report owners of changes to the measures.
Members of the enterprise analytics team report that creating Power Bl reports and adjusting tables and views in Azure Synapse is tedious because they must switch between the Power Bl workspaces and the Azure Synapse workspaces.
The information security team identifies that the user experience data is being shared externally.
Fabrikam plans to implement the following changes:
• Power Bl will be registered as a data source in Microsoft Purview.
• The analysts in the Product business unit will create a more automated process for deploying Power Bl reports and datasets to the User Experience workspace.
The enterprise analytics team plans to perform the following tasks:
• Update the DAX calculations in the Financial Model dataset.
• Create views in the Azure Synapse workspaces to speed up the parsing of user experience data.
• Create and document the change management process for shared Power Bl datasets.
From Microsoft Purview, analysts in all the business units must be able to see all the assets in the Power Bl tenant and the Azure Synapse workspaces. Power Bl asset information must include lineage to identify the data sources used by each report.
The information security team must identify all the Power Bl reports and datasets that contain Personally Identifiable Information (Pll).
Fabrikam requires a security solution for the Power Bl tenant.
The solution must meet the following requirements:
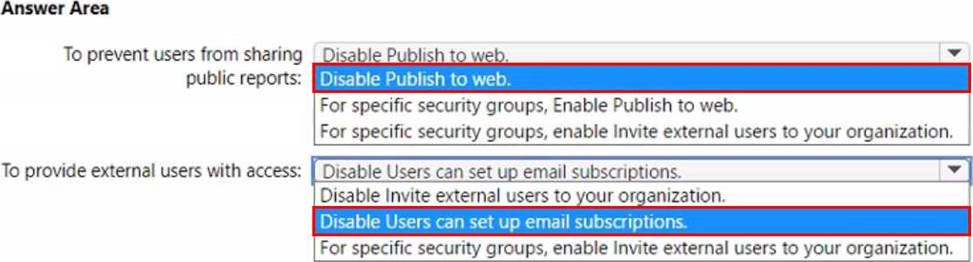
• Access to the tenant by external users must be approved by a manager and granted by the IT group.
• The external users must be prevented from publishing or modifying content in the tenant
• Users must be prevented from sharing Power Bl reports publicly to the internet.
The new process for deploying Power Bl reports and datasets to the User Experience workspace must ensure that the datasets point to the lake database to which the relevant dataset is deployed. The views in each lake database must present the data in a tabular format.
The enterprise analytics team needs to notify the report owners of the planned changes. The solution must minimize administrative effort.
What should the team do?
- A . Locate all the downstream reports, identify all the users That are assigned the Admin role, and then send an email to each user.
- B . Write a PowerShell script to access the Power Bl API that retrieves a list of downstream reports and a list of workspace administrators, and then send an email to each workspace administrator.
- C . Perform impact analysis on the Financial Model dataset to notify the workspace contacts.
- D . Perform impact analysis feature on the lake database data source to notify the workspace contacts.
You need to recommend a solution for the analysts in the Finance and Accounting business unit to mitigate the increase in maintenance of their assets in the Power Bl tenant.
Which two actions should you recommend? Each correct answer presents part of the solution. NOTE: Each correct selection is worth one point.
- A . Use Microsoft Purview to search for datasets that contain the relevant data.
- B . Perform impact analysis on the relevant data source.
- C . Create a live connection to a Power Bl dataset.
- D . Create a Power Bl template app.
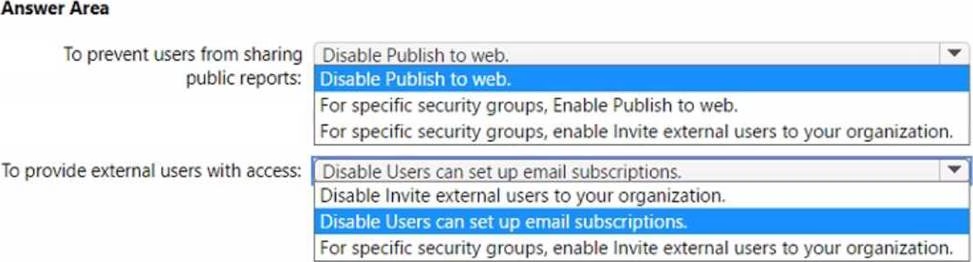
HOTSPOT
You need to recommend a security solution for the Power Bl tenant to control external data sharing.
The solution must meet the technical requirements.
What should you recommend? To answer, select the appropriate options in the answer area. NOTE: Each correct selection is worth one point.
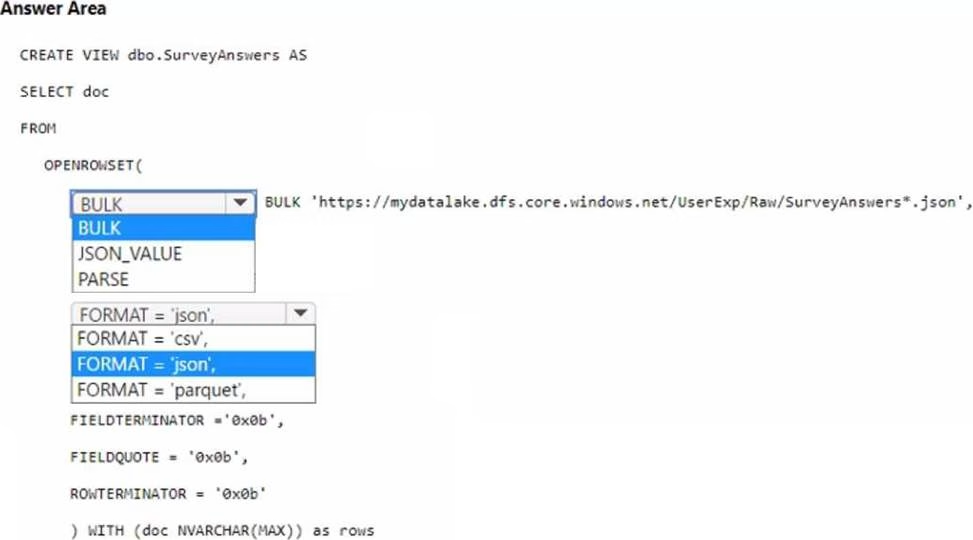
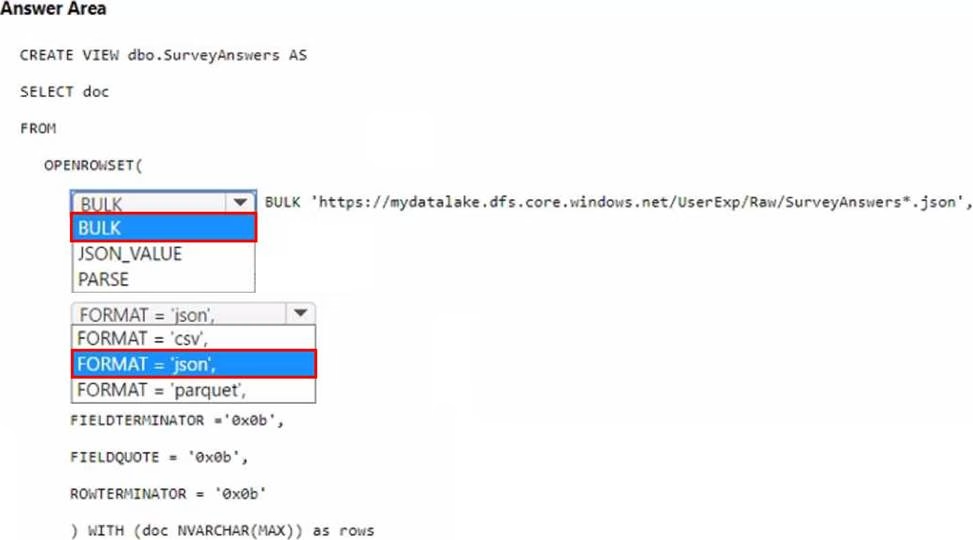
HOTSPOT
The enterprise analytics team needs to create a view for the survey response data. The solution must meet the technical requirements.
How should you complete the code? To answer, select the appropriate options in the answer area. NOTE: Each correct selection is worth one point.
Latest DP-500 Dumps Valid Version with 83 Q&As
Latest And Valid Q&A | Instant Download | Once Fail, Full Refund
