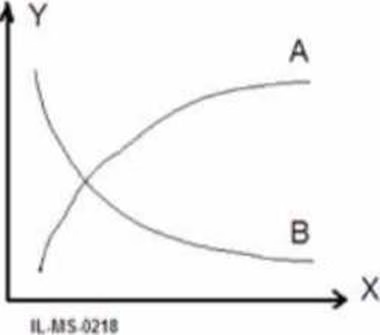
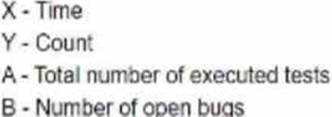
The following chart represents metrics related to testing of a project that was competed. Indicate what is represented by tie lines A, B and the axes X.Y
A)
B)
C)
D)
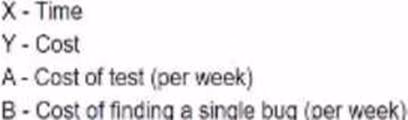
A . Option A
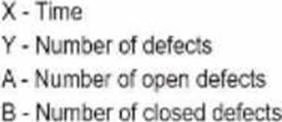
B . Option B
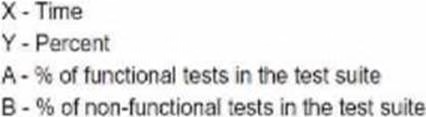
C . Option C
D . Option D
Answer: D
Explanation:
Option D correctly explains what is represented by the lines A, B and the axes X, Y in a testing metrics chart.
According to option D:
X-axis represents Time
Y-axis represents Count
Line A represents Number of open bugs
Line B represents Total number of executed tests
This information is essential in understanding and analyzing the testing metrics of a completed project.
Reference: ISTQB Certified Tester Foundation Level (CTFL) v4.0 Syllabus, Section 2.5.1, Page 35.
Latest ISTQB-CTFL Dumps Valid Version with 76 Q&As
Latest And Valid Q&A | Instant Download | Once Fail, Full Refund
