The use of station warning lights, tool boards and jidohka devices in the application of Lean accomplish which of these principles?
- A . Pilferage Minimization
- B . Visual Factory
- C . Management Awareness
- D . Operator Attentiveness
A Lean Principle that addresses efficiency by the process worker is called ____________________?
- A . Visual Factory
- B . Supervising
- C . Training
- D . Standardizing
While management of a company must set the stage for all improvement efforts, which of these 5S’s is primarily driven by management?
- A . Straighten
- B . Sort
- C . Shine
- D . Sustain
As part of a Visual Factory plan __________ cards are created and utilized to identify areas in need of cleaning and organization.
- A . Kanban
- B . Kaizen
- C . Poke-Yoke
- D . WhoSai
The use of Kanbans work best with pull systems for determining the timing of which products or services are produced.
- A . True
- B . False
When a Belt applies the practice of Poka-Yoke to a project challenge she is attempting to make certain the activity is _______________ .
- A . Well documented
- B . Removed from the line
- C . Mistake proofed
- D . Highly visible
The Lean Principle action in the 5S approach that deals with having those items needed regularly at hand and those items need less regularly stored out of the way is known as ___________.
- A . Shining
- B . Standardizing
- C . Sustaining
- D . Sorting
SPC on the outputs is more preferred than SPC on the inputs when implementing SPC for your process.
- A . True
- B . False
Significant variation in process performance is a consequence of several causes that can be classified using which of the terminologies shown. (Note: There are 2 correct answers).
- A . Common
- B . Random
- C . Uneducated
- D . Special
- E . Vital
When it comes to Control one of the most effective means of eliminating defects is to ____________.
- A . Train personnel often and thoroughly
- B . Keep a Six Sigma project going on the process at all times
- C . Design defect prevention into the product
- D . Have each process consist of no more than five steps
A periodic time frame can be used to arrange for Control Limit and Center Line calculations with good SPC implementation in a process.
- A . True
- B . False
The data on SPC charts are typically constructed such that they have the most recent data point on the right hand side.
- A . True
- B . False
Which statement(s) describe an undesirable situation when implementing SPC?
- A . The lower Control Limit for the R chart is equal to zero
- B . Attempt to use SPC for tracking transaction times at a warehouse
- C . A process is in Statistical Control before implementation of SPC
- D . The Control Limits are wider than the customer specification limits
If a process has Outliers which pair of charts is most preferable if subgroups will exist for the Continuous Data?
- A . Individual―Moving Range
- B . Xbar-R Charts
- C . Xbar-S Charts
- D . nP and P Charts
After a Belt has put data through the smoothing process which chart would be used to look for trends in the data?
- A . Moving Average Chart
- B . Multi-Vari Chart
- C . X bar Chart
- D . Pareto Chart
A Belt concludes a Lean Six Sigma project with the creation of a Control Plan. At what point can the Control Plan be closed?
- A . Never, a Control Plan is a living document
- B . As soon as the Champion signs off
- C . Within 30 days of the LSS project review team meeting
- D . After the project has been presented at the recognition event
When analyzing a data set we frequently graph one metric as a function of another. If the slope of the Correlation line is -2.5 we would say the two metrics are ___________ correlated?
- A . Positively
- B . Not
- C . Negatively
- D . None
Multiple Linear Regressions (MLR) is best used when which of these are applicable? (Note: There are 3 correct answers).
- A . Non-linear relationships between the inputs X’s and output Y
- B . Uncertainty in the slope of the linear relationship between an X and a Y
- C . Relationships between Y (output) and more than one X (Input)
- D . Preventing the use of a Designed Experiment if unnecessary
- E . We assume that the X’s are independent of each other
Fractional Factorial designs for an experimental approach are used when ____________ about the multiple metric interaction in a process.
- A . Much is known
- B . Little is known
- C . We don’t care
- D . Data exists
A Belt will occasionally do a quick experiment referred to as an OFAT which stands for ____________________.
- A . Only a Few Are Tested
- B . Opposite Factors Affect Technique
- C . One Factor At a Time
- D . Ordinary Fractional Approach Technique
Which statement(s) are correct for the Regression Analysis shown here? (Note: There are 2 correct answers).
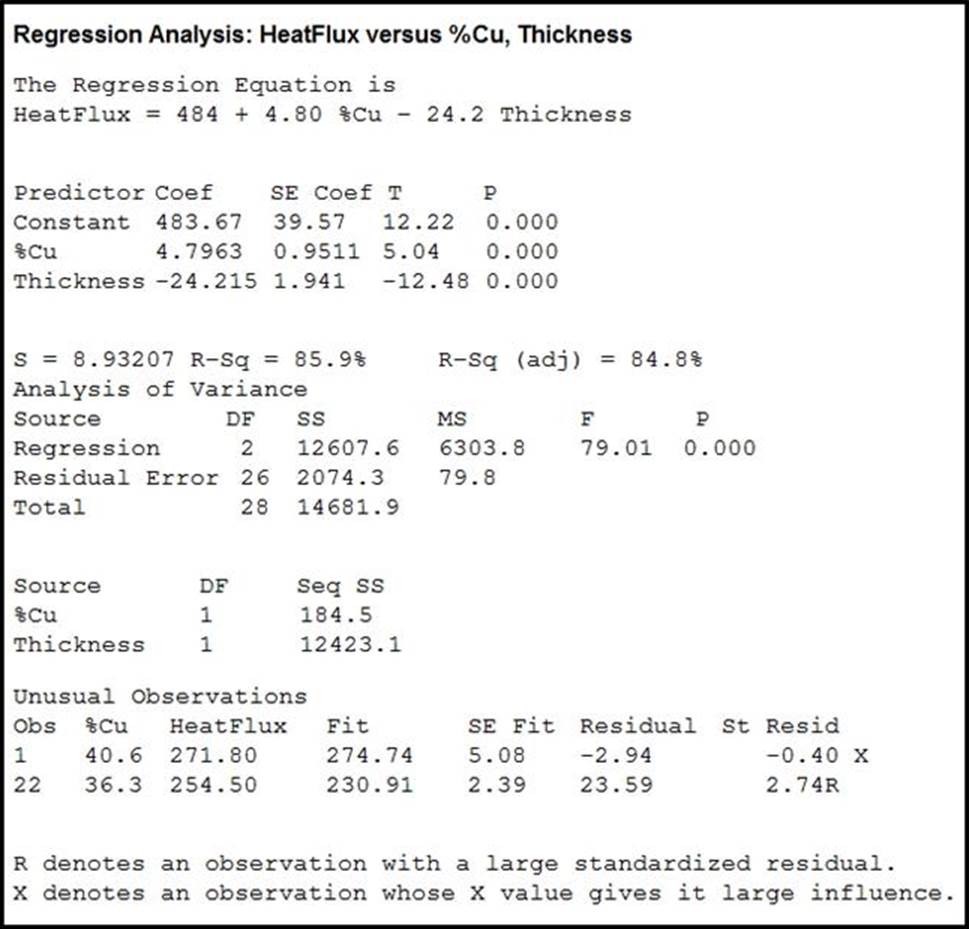

- A . This Regression is an example of a Multiple Linear Regression.
- B . This Regression is an example of Cubic Regression.
- C . %Cu explains the majority of the process variance in heat flux.
- D . Thickness explains over 80% of the process variance in heat flux.
- E . The number of Residuals in this Regression Analysis is 26.
The Regression Model for an observed value of Y contains the term β which represents the Y axis intercept when X = 0.
- A . True
- B . False
Which statement(s) are true about the Fitted Line Plot shown here? (Note: There are 2 correct answers).
- A . When Reactant increases, the Energy Consumed increases.
- B . The slope of the equation is a positive 130.5.
- C . The predicted output Y is close to -18 when the Reactant level is set to 6.
- D . Over 85 % of the variation of the Energy Consumed is explained by the Reactant via this Linear Regression.
After reviewing the Capability Analysis shown here select the statement(s) that are untrue.
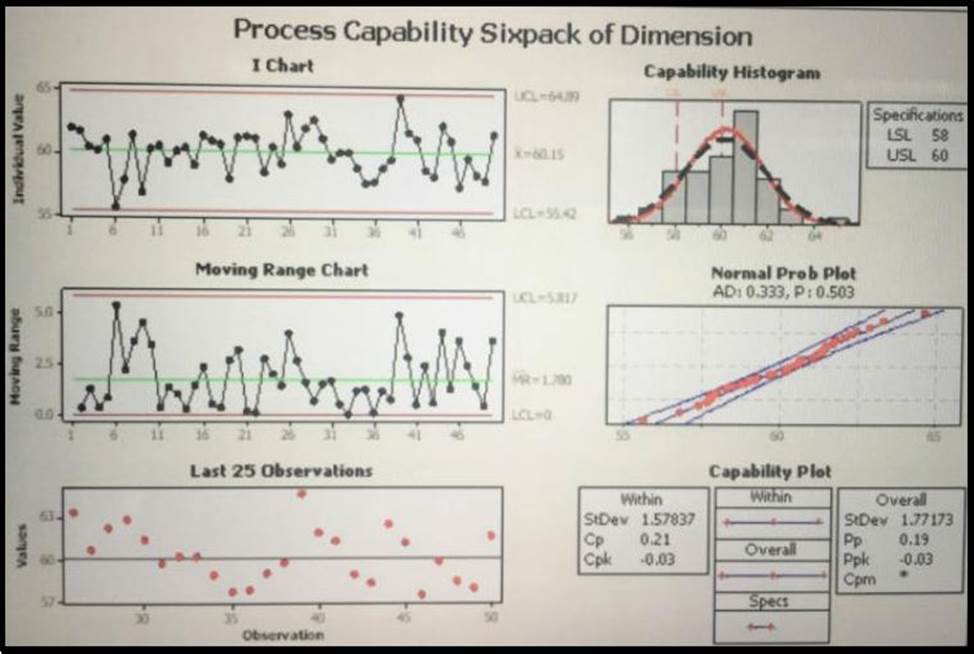

- A . The process is properly assumed to be a Normal process
- B . The Mean of the process moving range is 1.78
- C . The process is out of Control
- D . This Capability Analysis used subgroups
- E . Majority of the dimensional values are outside of the tolerance than within
The actual experimental response data varied somewhat from what a Belt had predicted them to be.
This is the result of which of these?
- A . Inefficiency of estimates
- B . Residuals
- C . Confounded data
- D . Gap Analysis
What is the Cycle Time, in minutes, for a process having a Throughput of 360 units per hour?
- A . 0.167
- B . 0.333
- C . 0.667
- D . 1.333
The generation of a Regression Equation is justified when we _____________. (Note: There are 4 correct answers).
- A . Expect the relationship to be Linear between the output and inputs
- B . Know that there is a non-linear relationship between output and input(s)
- C . Need to understand how to control a process output by controlling the input(s)
- D . Experience several process defects and have no other way to fix hem
- E . When it is very expensive or too late to measure the output
According to the definition of Rolled Throughput Yield which of the following items best describe the purpose of RTY?
- A . A function of Y=f(x)
- B . Determines incremental Growth
- C . Isolates the increase throughput
- D . Accounts for rejects and reworks
The following Business Case is constructed properly. “During fiscal year 2008 the warranty returns for electric razor Model 312 were 1.3%. This represents a gap of 0.5% over target costing the company $18,500 per month.”
- A . True
- B . False
Which statement(s) are true about the Fitted Line Plot shown here? (Note: There are 2 correct answers).
- A . When Reactant increases, the Energy Consumed increases.
- B . The slope of the equation is a positive 130.5.
- C . The predicted output Y is close to -18 when the Reactant level is set to 6.
- D . Over 85 % of the variation of the Energy Consumed is explained by the Reactant via this Linear Regression.
Select all the statements that are true after reviewing the Capability Analysis shown here. (Note: There are 4 correct answers).
- A . The process is out of Control.
- B . The process is properly assumed to be a Normal process.
- C . The Mean of the process moving range is 1.78.
- D . This Capability Analysis used subgroups.
- E . Majority of the dimensional values are outside of the tolerance than within.
A Six Sigma tool that helps to screen factors by using graphical techniques to logically subgroup multiple discrete X’s plotted against a continuous Y is known as a _____________Chart.
- A . SIPOC
- B . Multi-Vari
- C . Box Plot
- D . Whisker
A primary benefit of using a Multi-Vari Chart is it provides a visual presentation of two-way interactions.
- A . True
- B . False
__________ Distributions occur when data comes from several sources that are supposed to be the same yet are not.
- A . Skewed
- B . Bimodal
- C . Gaussian
- D . Tri-peaked
Bias in Sampling is an error due to lack of independence among random samples or due to systematic sampling procedures.
- A . True
- B . False
To draw inferences about a sample population being studied by modeling patterns of data in a way that accounts for randomness and uncertainty in the observations is known as ____________________.
- A . Influential Analysis
- B . Inferential Statistics
- C . Physical Modeling
- D . Sequential Inference
For a Normal Distribution the Mean, Median and Mode are the same data point.
- A . True
- B . False
When two Inputs have an impact on the Output together yet seem to have no or little impact on their own this is called a/an ________________.
- A . Interaction
- B . Oddity
- C . Coincidence
- D . Impossibility
Hypothesis Testing can save time and help avoid high costs of experimental efforts by using existing data.
- A . True
- B . False
It is a Type II error if we decide to reject the Null Hypothesis when it is actually true.
- A . True
- B . False
A Belt experienced an Alpha of .05 and a Beta of .10 and knew these are the most common risk levels when running a Statistical test.
- A . True
- B . False
Inferential Statistics is largely about Significance. There are both Practical and _______________ Significance to consider during an analysis of data in a Lean Six Sigma project.
- A . Problematic
- B . Impractical
- C . Usable
- D . Statistical
The Central Limit Theorem helps us understand the ___________ we are taking and is the basis for using sampling to estimate population parameters.
- A . Analysis
- B . Kurtosis
- C . Risk
- D . Route
Hypothesis Tests determine the probabilities of differences between observed data and the hypothesis being solely due to _________ based on the result of the P-values.
- A . Human error
- B . Measurement error
- C . Shift differences
- D . Chance
The Alpha level of a test (level of significance) represents the yardstick against which P-values are measured and the Null Hypothesis is rejected if the P-value is which of these?
- A . Less than the Alpha level.
- B . Greater than the Alpha level.
- C . Greater than the Beta and Alpha level.
- D . Less than one minus Alpha.
- E . Less than the power of one minus Beta.
A 1-Sample t-test is used when you want to compare the Median of one distribution to a target value.
- A . True
- B . False
When a Belt is analyzing sample data she should keep in mind that 95% of Normally Distributed data is within +/- 2 Standard Deviations from the Mean.
- A . True
- B . False
The Standard Deviation for the distribution of Means is called the ___________ and approaches zero as the sample size reaches 30.
- A . Standard Error
- B . Mean Deviation
- C . Mean Spread
- D . Mean Error
Due to excessive pollution, GREEN Solutions Inc. is considering subsidizing public transportation to work for its employees. According to the manager it takes an average weekday commute of 39 minutes with a Standard Deviation of 7 minutes for the employees to get to work while they use their personal vehicles for their office commute while the management set a policy of not more than 40 minutes for their daily one-way commute. A survey conducted one day on 70 employees showed an average of 34 minutes commuting time using the metro public transportation system with a Standard Deviation of 21 minutes.
Assuming a Normal Distribution for the commute times by either personal or public transportation, which of these is true?
- A . The probability that they would arrive on time using personal vehicles is much higher than using the metro public transportation system (MPTS)
- B . The probability that they would arrive on time using the MPTS is much higher than using their personal vehicles
- C . The two probabilities are about the same excepting in one case the consistency is higher than the other
- D . We need to compile more data around weekends to incorporate for traffic differences
- E . When Standard Deviation is higher the probability goes down and so the MPTS is worse
According to a manager it takes an average weekday commute of 39 minutes with a Standard Deviation of 7 minutes for the employees to get to work when they use their personal vehicles for their office commute while management set a policy of not more than 40 minutes for their daily one-way commute. A survey conducted one day on 70 employees showed an average of 34 minutes commuting time using the metro public transportation system with a Standard Deviation of 21 minutes.
For the employees choosing to increase their chances to come on time using personal transportation their variation should be reduced to ___________?
- A . 1 minute
- B . 6 minutes
- C . 3.5 minutes
- D . Eliminate it to 0.0 minutes
According to a manager it takes an average weekday commute of 39 minutes with a Standard Deviation of 7 minutes for the employees to get to work while they use their personal vehicles for their office commute while the management set a policy of not more than 40 minutes for their daily one-way commute. A survey conducted one day on 70 employees showed an average of 34 minutes commuting time using the metro public transportation system with a Standard Deviation of 21 minutes.
If the Standard Deviation is uncontrollable then the other option to increase the probability of coming in on time via personal vehicles to work could be ____________?
- A . Increase the average time of commute
- B . Maintain the average time of commute and change route to work
- C . Reduce average commute time to work by departing earlier
- D . Change policy at work and request for flexible times based on location
Which of the following is used to test the significance for the analysis of a Variance Table?
- A . t Test
- B . F Test
- C . Chi Square Test
- D . Acid Test
Non-parametric testing is done when which of these are applicable? (Note: There are 3 correct answers).
- A . When the traditional t tests don’t produce the results we need
- B . A Hypothesis Test for the Median of the population is in question
- C . It does not require data to come from Normally Distributed populations
- D . They look at the Median rather than the Mean of populations
- E . When there are no parameters to measure in the process
The Mann-Whitney Test is used to test if the Means for two samples are different.
- A . True
- B . False
Contingency Tables are used to perform which of these functions?
- A . Illustrate one-tail proportions
- B . Analyze the "what if" scenario
- C . Contrast the Outliers under the tail
- D . Compare more than two sample proportions with each other
For the data shown here a Belt suspects the three grades are supplying the same results.
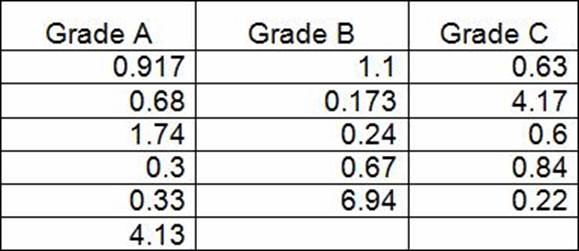

Which statement(s) are true for proper Hypothesis Testing?
- A . The most appropriate Central Tendency to test is the Means
- B . An appropriate test to test Central Tendency is the Levene’s test
- C . An appropriate test to test Central Tendency is the ANOVA test
- D . An appropriate test to test Central Tendency is the Mood’s Median test
If the data displayed in a Histogram displays two peaks the distribution would likely be _____________.
- A . Transformed
- B . Multi-skewed
- C . Bi-attribute
- D . Bimodal
The ____________ is important because it provides an estimate of the probability of an event occurring depending on the Standard Deviation from the Mean.
- A . Shewhart Principle
- B . Pareto Rule
- C . Mean/Mode Spread
- D . Empirical Rule
Skewed, or Mixed, Distributions occur when data comes from several sources that are supposed to be the same yet are not.
- A . True
- B . False
Measurement System Analysis is a procedure used to quantify all ____________ in the method or system used for taking measurements.
- A . Totals
- B . People involved
- C . Variation
- D . Summations