A data architect adds a field to an existing data model that contains new values for the ProductGroup.
The business analyst needs to efficiently update the app and meet these requirements:
– Use the existing charts, which are built using a master item dimension called ProductGroup
– Existing charts must use the new values for ProductGroup
– Business users must be able to compare the new and old values
How should the business analyst meet these requirements?
- A . Change the ProductGroup dimension using the new field, and create a new dimension in the master items for the old field.
- B . Create a calculated dimension on the charts to allow the users to compare the new value to the old value.
- C . Replace the dimensions on all charts to use the new ProductGroup field added to the data model.
- D . Use set analysis on the chart measures to see the difference in ProductGroup between the new field and the old field.
A business analysis must create new master items for quarterly calendar measures with company-specific conventions based on:
– The Date field and the Sum of Sales
– The new master items will calculate QTD Sales, Current QTD Sales, Last QTD Sales, Current Quarter Sales, Last Year Current Quarter Sales, and Last Quarter Sales
Which three steps should the business analyst take to meet these requirements? (Choose three.)
- A . Right-click the Date field in the assets panel and Select Create calendar measures
- B . Right-click the Sales field in the assets panel and Select Create calendar measures
- C . Select Date, Sales, Sum, and Quarterly
- D . Sales to master items, rename master items
- E . Select Date, Sales, Sum, and Yearly
A business analyst is building a dashboard to track customer loyalty.
The app has several requirements:
– A table that shows the total number of purchases by customer
– A scatter plot that shows the correlation between the number of purchases and total spent by customer
– A bar chart that shows the top five customers by sales
Which two measures should the business analyst use to meet these requirements? (Choose two.)
- A . Customer Ranking
- B . Number of Purchases
- C . Purchase Amount
- D . Number of Products
- E . Correlation
A client wants to see a bar chart with a single measure and three dimensions: Region, Product Category, and Month.
The business analyst creates a bar chart with the measure, Sum (Revenue).
Which final step should the business analyst take to complete the chart?
- A . Add Region, Product Category, and Month as three different dimensions
- B . Create a single master dimension with Region, Product Category, and Month
- C . Add Region as a dimension, add Product Category and Month as alternate dimensions
- D . Create a cyclic group with Region, Product Category, and Month as dimensions
A large organization with more than 100 departments wants to raise money for a donation in the next 30 days. This year, leadership decides to increase employee participation through a competition. Team members of departments that raise $10,000 or more receive two additional holidays.
Leadership needs the following capabilities:
– Ability to view the total donation amount
– Ability to identify departments that raise $10,000 or more
Which two visualizations should the business analyst use without set analysis to meet these requirements? (Choose two.)
- A . Pie chart
- B . Box plot
- C . Bar chart
- D . KPI
- E . Treemap
A retailer with 300 locations worldwide needs to analyze its workforce to prepare for its next board meeting. The two most important items to the board members are total compensation and number of employees by city.
Which visualization should a business analyst use to meet this requirement?
- A . Scatter plot
- B . Bar chart
- C . Pivot table
- D . Map
A business analyst wants to develop a Qlik Sense app with some key performance indicators on the dashboard. The analyst decides to use two KPI objects to represent key metrics for the organization.
Which two measures should the business analyst use to meet these requirements? (Choose two.)
- A . Margin by region
- B . Number of products by customer
- C . Number of customers
- D . Number of products sold
- E . Number of customers by region
A bus company wants to analyze customer travel patterns to add additional services or create new routes.
The business analyst needs to consider the following data:
– 190 routes across the city
– Start and end location of each route
– Volume of customers travelling per hour
– Customer complaints when buses are full
Which visualization should a business analyst use to meet this requirement?
- A . Area layer map
- B . Treemap
- C . Line layer map
- D . Scatter plot
A business analyst must adjust and create new visualizations on a published app in Qlik Sense Enterprise. The changes need to be made very quickly.
Which two actions can the business analyst perform in the app on the hub? (Choose two.)
- A . Duplicate sheets to edit visualizations
- B . Create new sheets and visualizations
- C . Add data to the app
- D . Create and edit master items
- E . Create variables in the app
A business analyst must display current year sales versus previous year sales by region, sub-region, and city.
The result will be a pivot table, with rows for the region, sub-region, and city, and columns for Current Year Sales and Previous Year Sales.
Which calculated expressions should the business analyst create to meet these requirements?
- A .

- B .

- C .

- D .


A business analyst must display current year sales versus previous year sales by region, sub-region, and city.
The result will be a pivot table, with rows for the region, sub-region, and city, and columns for Current Year Sales and Previous Year Sales.
Which calculated expressions should the business analyst create to meet these requirements?
- A .
- B .
- C .
- D .
Create two gauges, one for each measure and set the color for each appropriately
A business analyst is creating a dashboard to analyze supply chains.
The app must contain several elements:
– A bar chart that shows a number of products and product groups handled by shipper
– A map that shows the number of shipments sent from factory locations
– A bar chart that shows average delivery costs by shipper
Which dimensions should the business analyst use for this app?
- A . Product, Shipper, FactoryLocation
- B . Shipper, FactoryLocation
- C . Shipper, Product
- D . Product, ProductGroup, Shipper
Refer to the exhibit.

A business analyst must analyze sales using an existing sales order app.
– The Orders table in the app was added from a QVD file using the data manager
– The Orders table in the app and the QVD do NOT contain a SalesAmount field
– SalesAmount can be calculated by multiplying the Quantity and UnitPrice
How should the business analyst add a SalesAmount field into the Orders table?
- A . In the data manager, create a new calculated field, SalesAmount, and set the expression value to Sum (UnitPrice * Quantity)
- B . In the data mode viewer, add a calculated field named SalesAmount with the expression UnitPrice * Quantity
- C . In the data manager, add a calculated field named SalesAmount with the expression UnitPrice * Quantity
- D . In the Orders QVD file, add an additional field named SalesAmount with the expression UnitPrice * Quantity
Refer to the exhibit.
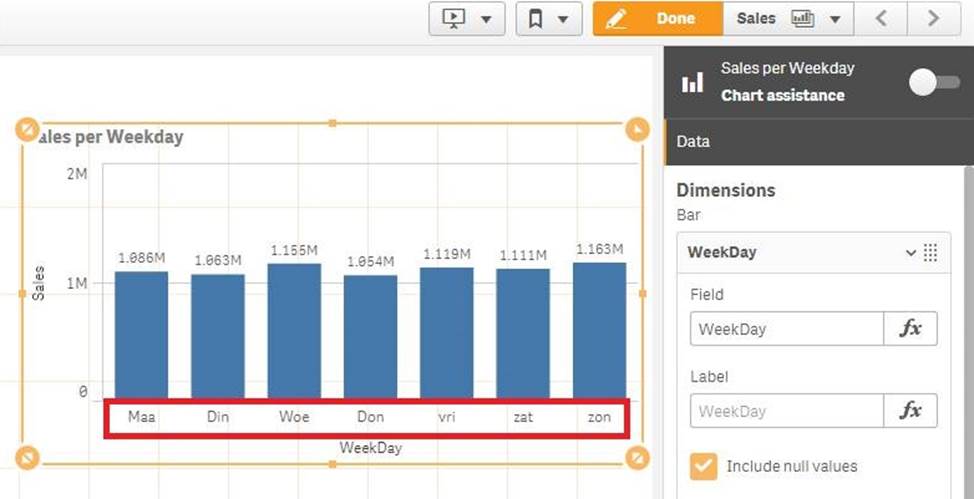

A business analyst creates a bar chart and notices the weekdays are NOT in a US default format. The analyst does NOT have permissions to enter the data load editor and edit the data. The analyst only has a few minutes before the meeting to show the insights to a manager. The business analyst wants to quickly customize the chart to show the weekdays in US format.
Which action should the business analyst take to fix the chart?
- A . Change the dimension label using the DATE () function to specify the right data format.
- B . Change the dimension to a calculated dimension to specify the right data format.
- C . Change the dimension label to a calculated dimension using an IF () function.
- D . Change the dimension to a calculated dimension using the REPLACE () function.
D
Explanation:
Reference: https://community.qlik.com/t5/QlikView-Documents/Class-Replace-Dual-Functions/tap/1482389
Refer to the exhibits.
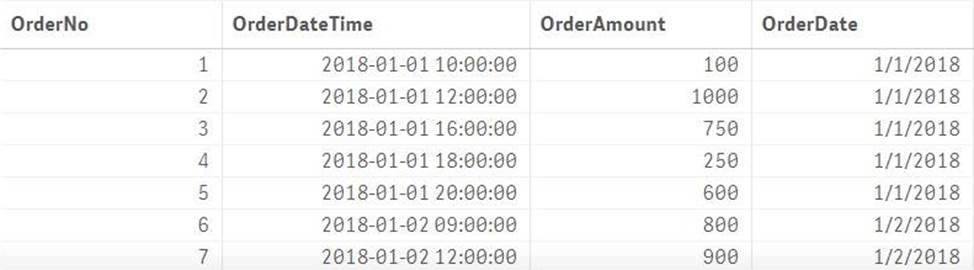

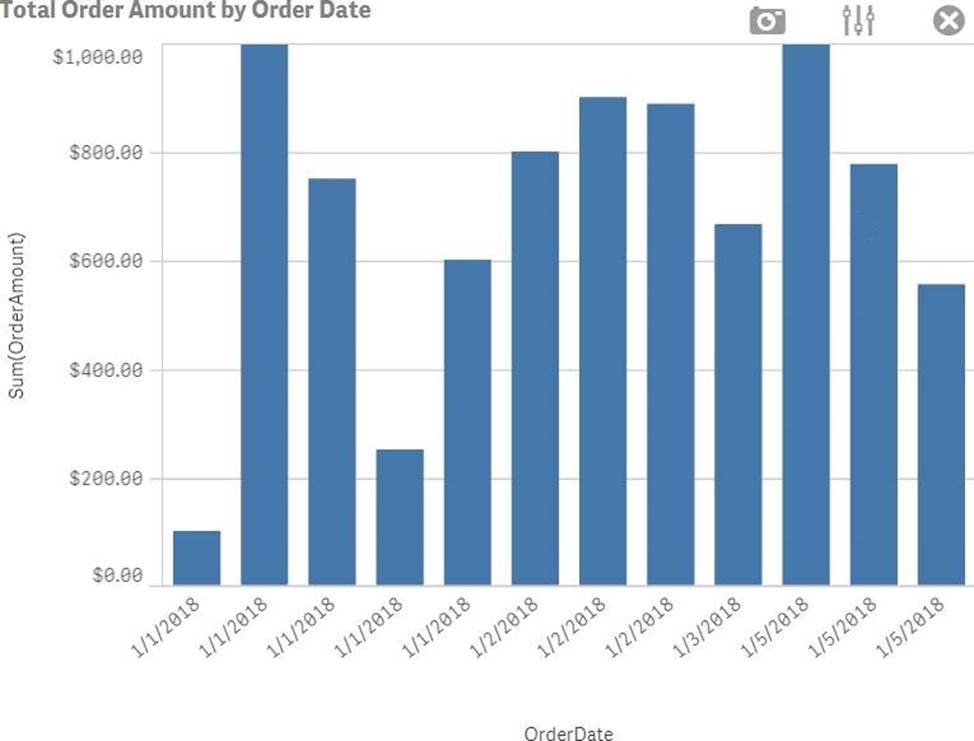

A business analyst must create a bar chart to show the total value of orders processed per day. The dataset loaded by the data architect only contains the OrderNo, OrderDateTime, and OrderAmount. The business analyst creates a calculated field, OrderDate, using the expression, Date (OrderDateTime). The bar chart does NOT present the information correctly.
How should the business analyst fix the error?
- A . Change the OrderDate number formatting to ‘Date’ in the properties panel
- B . Create a new calculated field for OrderDate with: Date (Floor (OrderDateTime))
- C . Change the OrderDate field type to Date’ in the format ‘YYYY-MM-DD’ in the data manager.
- D . Create a new calculated field for OrderDate with: Date (LTrim (OrderDateTime,10))
C
Explanation:
Reference: https://1c-predpriyatie-qlik.ivan-shamaev.ru/wp-content/uploads/2018/01/ Manage_data_Qlik_Sense.pdf
A business analyst is NOT familiar with the data and is using insight advisor to create a number of visualizations.
Which steps should the business analyst take to add the visualizations to a sheet?
- A . Click Generate insights to find visualizations, then click Add to sheet
- B . Use the selection tool to find visualizations, then click Add to sheet
- C . Use smart search to find visualizations, then click Add to sheet
- D . Drag and drop fields on the workspace, then click Add to sheet
A
Explanation:
Reference: https://help.qlik.com/en-US/sense/September2018/Subsystems/Hub/Content/Sense_Hub/ Visualizations/creating_visualizations_insights.htm
Refer to the exhibit.
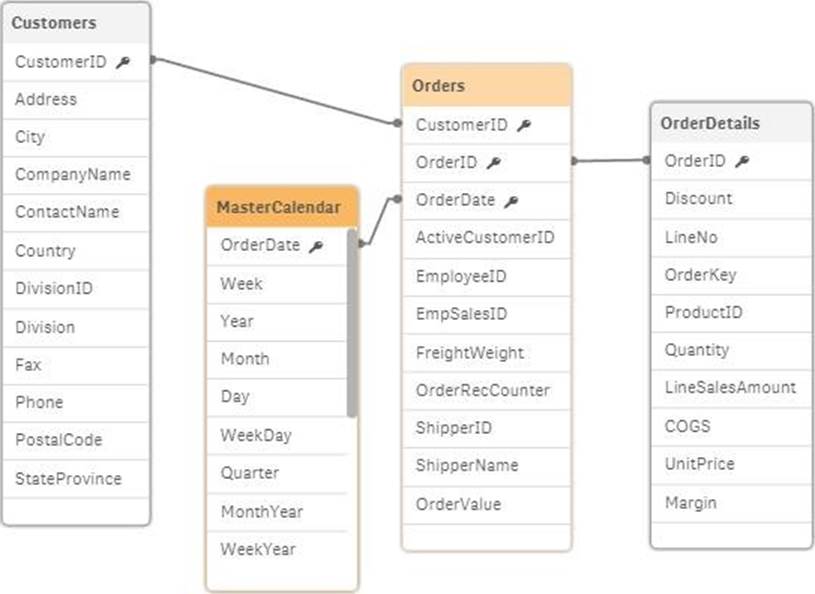

A business analyst is testing an existing app that returns unexpected results.
– Using the selection tool, the business analyst observes the following behavior.
– Select a CompanyName and the associated OrderID records are white
– Select a Year and all OrderID records are gray
– Select an OrderID and the Quarter values are all gray, but the CompanyNames are white
– Select a ProductID and the associated ShipperName and OrderDates are white, but the Year is gray
What is causing these results?
- A . OrderID should be the key field in the MasterCalendar
- B . The logical model is NOT a star schema
- C . The OrderDate fields are different data types
- D . MasterCalendar should be associated to the OrderDetails table
B
Explanation:
Reference: https://mindmajix.com/snowflake-and-star-schema-in-qlikview
A company has customers in 16 countries. The majority of the customers are in Germany.
A business analyst creates a filter pane for Country, and wants “Germany” listed first. The rest of the countries should be listed in alphabetical order.
Which method should the business analyst use to meet this requirement?
- A . Edit the sheet, select Chart, Properties panel, Custom sorting, then select Germany
- B . Edit the sheet, select Chart, Properties panel, Custom sorting, then click Descending Frequency
- C . In the data manager, edit the table, select Country, then select Order from the data profiling card
- D . In the data manager, edit the table, select Country, then select Order from the column header