Topic 1, Litware, Inc.
Overview
Litware, Inc. is a retail company that sells outdoor recreational goods and accessories. The company sells goods both online and at its stores located in six countries.
Azure Resources
Litware has the following Azure resources:
• An Azure Synapse Analytics workspace named synapseworkspace1
• An Azure Data Lake Storage Gen2 account named datalake1 that is associated with synapseworkspace1
• A Synapse Analytics dedicated SQL pool named SQLDW
Dedicated SQL Pool
SQLDW contains a dimensional model that contains the following table.
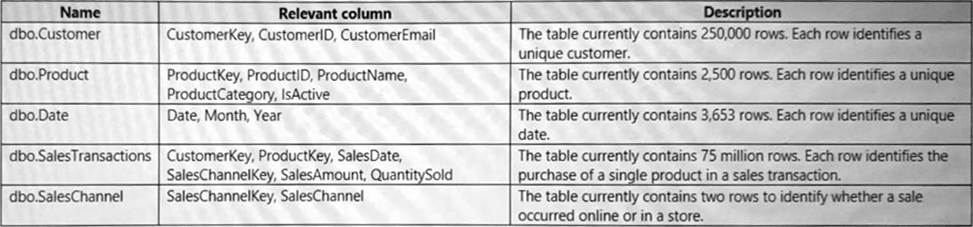

SQLDW contains the following additional tables.

SQLDW contains a view named dbo.CustomerPurchases that creates a distinct list of values from dbo.Customer [customeriD], dbo.Customer
[CustomerEmail], dbo.ProductfProductID] and dbo.Product[ProductName].
The sales data in SQLDW is updated every 30 minutes. Records in dbo.SalesTransactions are updated in SQLDW up to three days after being created. The records do NOT change after three days.
Power BI
Litware has a new Power Bl tenant that contains an empty workspace named Sales Analytics.
All users have Power B1 Premium per user licenses.
IT data analysts are workspace administrators. The IT data analysts will create datasets and reports.
A single imported dataset will be created to support the company’s sales analytics goals. The dataset will be refreshed every 30 minutes.
Analytics Goals
Litware identifies the following analytics goals:
• Provide historical reporting of sales by product and channel over time.
• Allow sales managers to perform ad hoc sales reporting with minimal effort.
• Perform market basket analysis to understand which products are commonly purchased in the same transaction.
• Identify which customers should receive promotional emails based on their likelihood of purchasing promoted products.
Litware plans to monitor the adoption of Power Bl reports over time. The company wants custom Power Bl usage reporting that includes the percent change of users that view reports in the Sales Analytics workspace each month.
Security Requirements
Litware identifies the following security requirements for the analytics environment:
• All the users in the sales department and the marketing department must be able to see Power B1 reports that contain market basket analysis and data about which customers are likely to purchase a product.
• Customer contact data in SQLDW and the Power B1 dataset must be labeled as Sensitive. Records must be kept of any users that use the sensitive data.
• Sales associates must be prevented from seeing the CustomerEmail column in Power B1 reports.
• Sales managers must be prevented from modifying reports created by other users.
Development Process Requirements
Litware identifies the following development process requirements:
• SQLDW and datalake1 will act as the development environment. Once feature development is complete, all entities in synapseworkspace1 will be promoted to a test workspace, and then to a production workspace.
• Power Bl content must be deployed to test and production by using deployment pipelines.
• All SQL scripts must be stored in Azure Repos.
The IT data analysts prefer to build Power Bl reports in Synapse Studio.
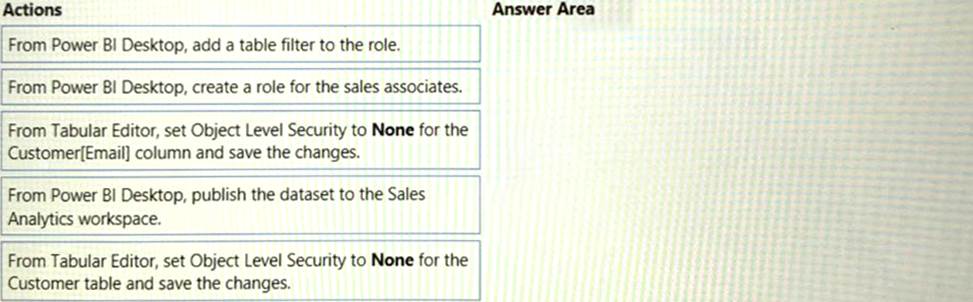
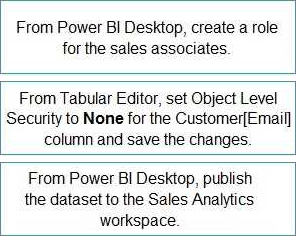
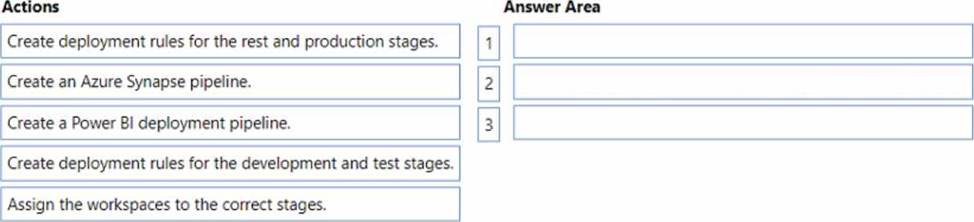
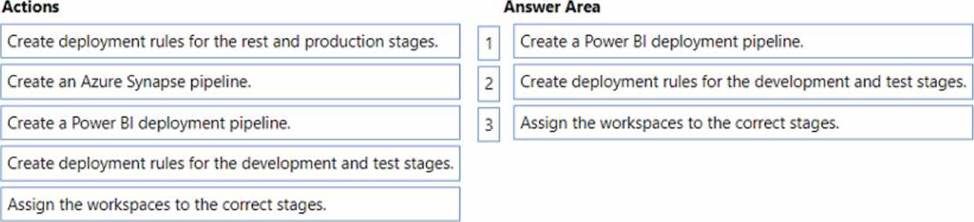
DRAG DROP
You need to implement object-level security (OLS) in the Power Bl dataset for the sales associates.
Which three actions should you perform in sequence? To answer, move the appropriate actions from the list of actions to the answer area and arrange them in the correct order.


What should you configure in the deployment pipeline?
- A . a backward deployment
- B . a selective deployment
- C . auto-binding
- D . a data source rule
D
Explanation:
Development Process Requirements
Litware identifies the following development process requirements:
SQLDW and datalake1 will act as the development environment. Once feature development is complete, all entities in synapseworkspace1 will be promoted to a test workspace, and then to a production workspace.
Power BI content must be deployed to test and production by using deployment pipelines.
Create deployment rules
When working in a deployment pipeline, different stages may have different configurations. For example, each stage can have different databases or different query parameters. The development stage might query sample data from the database, while the test and production stages query the entire database.
When you deploy content between pipeline stages, configuring deployment rules enables you to allow changes to content, while keeping some settings intact. For example, if you want a dataset in a production stage to point to a production database, you can define a rule for this. The rule is defined in the production stage, under the appropriate dataset. Once the rule is defined, content deployed from test to production, will inherit the value as defined in the deployment rule, and will always apply as long as the rule is unchanged and valid.
You can configure data source rules and parameter rules.
Incorrect:
Not B: if you already have a steady production environment, you can deploy it backward (to Test or Dev, based on your need) and set up the pipeline. The feature is not limited to any sequential orders.
Reference: https://docs.microsoft.com/en-us/power-bi/create-reports/deployment-pipelines-get-started#step-4—create-deployment-rules
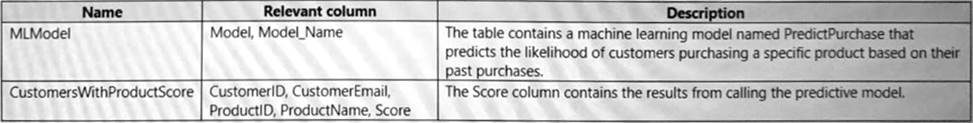
HOTSPOT
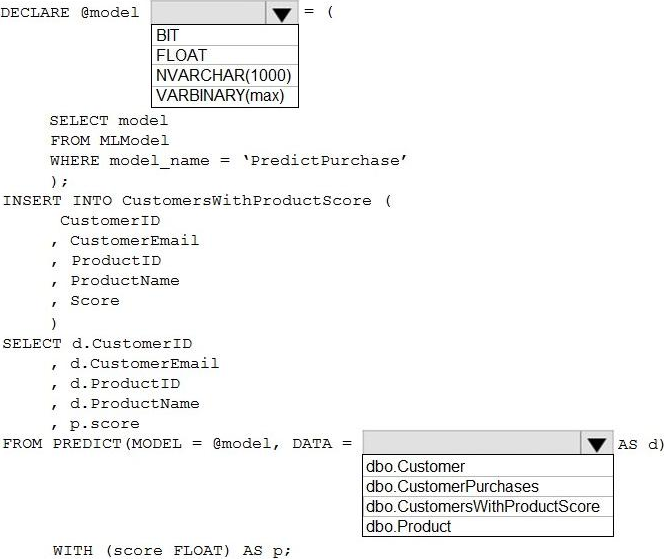
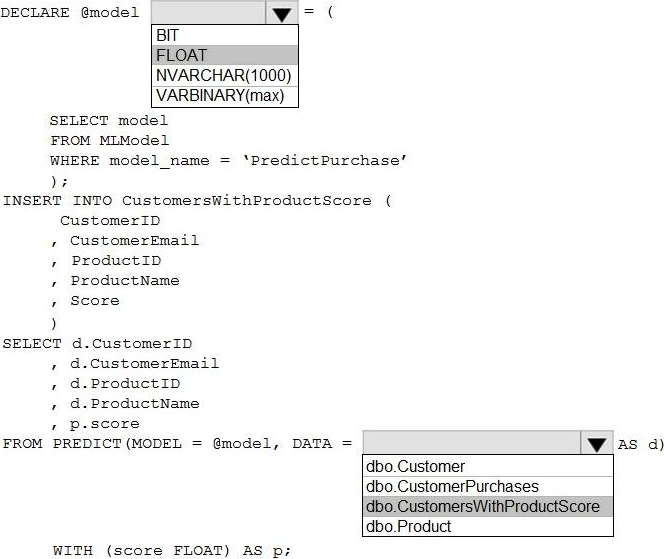
You need to populate the Customers With Product Score table.
How should you complete the stored procedure? To answer, select the appropriate options in the answer area. NOTE: Each correct selection is worth one point.

Explanation:
Box 1: FLOAT
Identify which customers should receive promotional emails based on their likelihood of purchasing promoted products.
FLOT is used in the last statement of the code: WITH (score FLOAT) as p;
From syntax: MODEL
The MODEL parameter is used to specify the model used for scoring or prediction. The model is specified as a variable or a literal or a scalar expression.
Box 2: dbo.CustomerWithProductScore
Identify which customers should receive promotional emails based on their likelihood of purchasing promoted products.
Only table CustomerWithProductScore has the required filed score.
From the syntax:
DATA
The DATA parameter is used to specify the data used for scoring or prediction. Data is specified in the form of a table source in the query. Table source can be a table, table alias, CTE alias, view, or table-valued function.
Reference: https://docs.microsoft.com/en-us/sql/t-sql/queries/predict-transact-sql
DRAG DROP
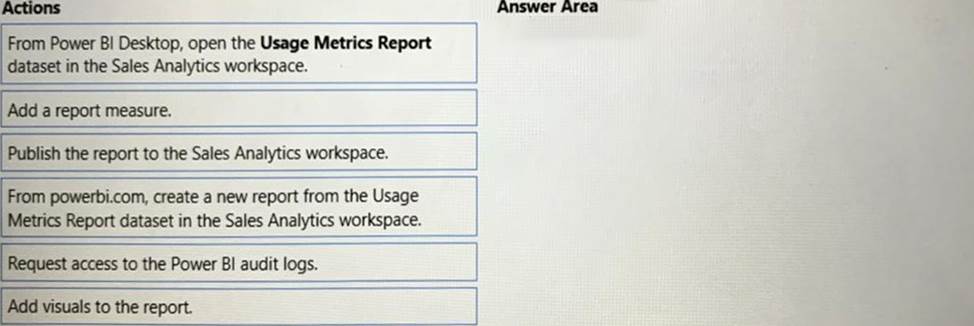
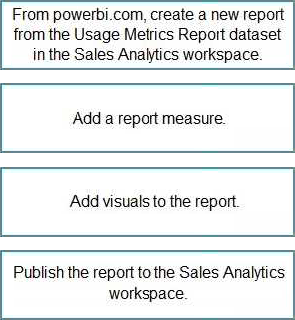
You need to create the customized Power Bl usage reporting. The Usage Metrics Report dataset has already been created. The solution must minimize development and administrative effort.
Which four actions should you perform in sequence? To answer, move the appropriate actions from the list of actions to the answer area and arrange them in the correct order.


Explanation:
Step 1: From powerbi.com, create a new report.
The company wants custom Power BI usage reporting that includes the percent change of users that view reports in the Sales Analytics workspace each month.
Step 2: Add a report measure
Measures are used in some of the most common data analyses. Simple summarizations such as sums, averages, minimum, maximum and counts can be set through the Fields well. The calculated results of measures are always changing in response to your interaction with your reports, allowing for fast and dynamic ad-hoc data exploration.
Step 3: Add visuals to the report
Step 4: Publish the report to the Sales Analytics workspace
Reference: https://docs.microsoft.com/en-us/power-bi/transform-model/desktop-measures
You need to configure the Sales Analytics workspace to meet the ad hoc reporting requirements.
What should you do?
- A . Grant the sales managers the Build permission for the existing Power Bl datasets.
- B . Grant the sales managers admin access to the existing Power Bl workspace.
- C . Create a deployment pipeline and grant the sales managers access to the pipeline.
- D . Create a PBIT file and distribute the file to the sales managers.
D
Explanation:
Allow sales managers to perform ad hoc sales reporting with minimal effort
Power BI report templates contain the following information from the report from which they were generated:
Report pages, visuals, and other visual elements
The data model definition, including the schema, relationships, measures, and other model definition items
All query definitions, such as queries, Query Parameters, and other query elements What is not included in templates is the report’s data.
Report templates use the file extension .PBIT (compare to Power BI Desktop reports, which use the .PBIX extension).
Note: With Power BI Desktop, you can create compelling reports that share insights across your entire organization. With Power BI Desktop templates, you can streamline your work by creating a report template, based on an existing template, which you or other users in your organization can use as a starting point for a new report’s layout, data model, and queries. Templates in Power BI
Desktop help you jump-start and standardize report creation.
Reference: https://docs.microsoft.com/en-us/power-bi/create-reports/desktop-templates
You need to recommend a solution to ensure that sensitivity labels are applied. The solution must minimize administrative effort.
Which three actions should you include in the recommendation? Each correct answer presents part of the solution. NOTE: Each correct selection is worth one point.
- A . From the Power Bl Admin portal, set Allow users to apply sensitivity labels for Power Bl content to Enabled.
- B . From the Power Bl Admin portal, set Apply sensitivity labels from data sources to their data in Power Bl to Enabled.
- C . In SQLDW. apply sensitivity labels to the columns in the Customer and Customers With Product Score tables.
- D . In the Power Bl datasets, apply sensitivity labels to the columns in the Customer and Customers With Product Score tables.
- E . From the Power Bl Admin portal, set Make certified content discoverable to Enabled.
ADE
Explanation:
A Synapse Analytics dedicated SQL pool is named SQLDW.
Customer contact data in SQLDW and the Power BI dataset must be labeled as Sensitive.
Records must be kept of any users that use the sensitive data.
A (not B): Enable sensitivity labels
Sensitivity labels must be enabled on the tenant before they can be used in both the service and in Desktop.
To enable sensitivity labels on the tenant, go to the Power BI Admin portal, open the Tenant settings pane, and find the Information protection section.
In the Information Protection section, perform the following steps:
✑ Open Allow users to apply sensitivity labels for Power BI content.
✑ Enable the toggle.
D (not C): When data protection is enabled on your tenant, sensitivity labels appear in the sensitivity column in the list view of dashboards, reports, datasets, and dataflows.
E: Power BI Tenant Discovery Setting include Make certified content discoverable.
Reference:
https://docs.microsoft.com/en-us/power-bi/enterprise/service-security-enable-data-sensitivity-labels
https://docs.microsoft.com/en-us/power-bi/enterprise/service-security-apply-data-sensitivity-labels
https://support.nhs.net/knowledge-base/power-bi-guidance/
How should you configure the Power BI dataset refresh for the dbo.SalesTransactions table?
- A . an incremental refresh of Product where the ModifiedDate value is during the last three days.
- B . an incremental refresh of dbo.SalesTransactions where the SalesDate value is during the last three days.
- C . a full refresh of all the tables
- D . an incremental refresh of dbo.SalesTransactions where the SalesDate value is during the last hour.
B
Explanation:
The sales data in SQLDW is updated every 30 minutes. Records in dbo.SalesTransactions are updated in SQLDW up to three days after being created. The records do NOT change after three days.
HOTSPOT
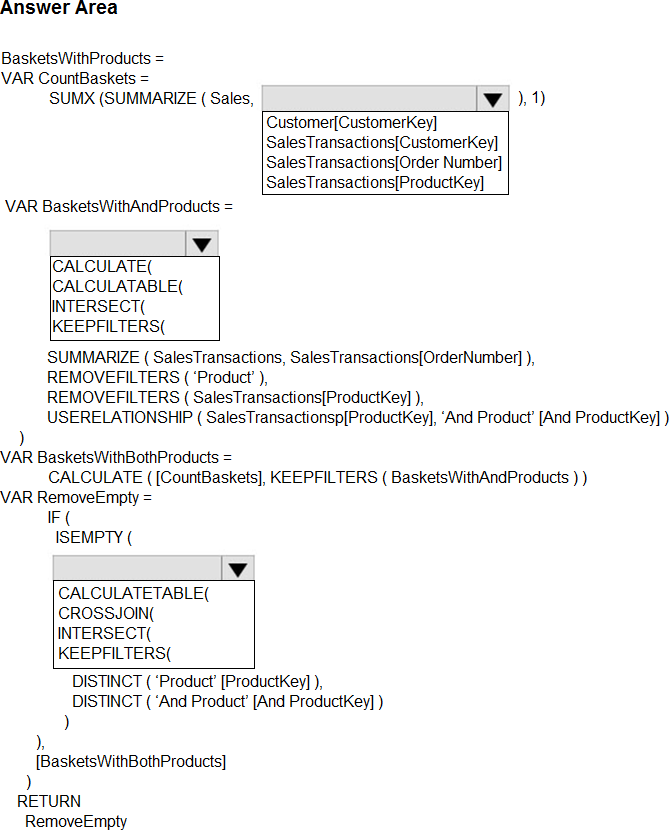
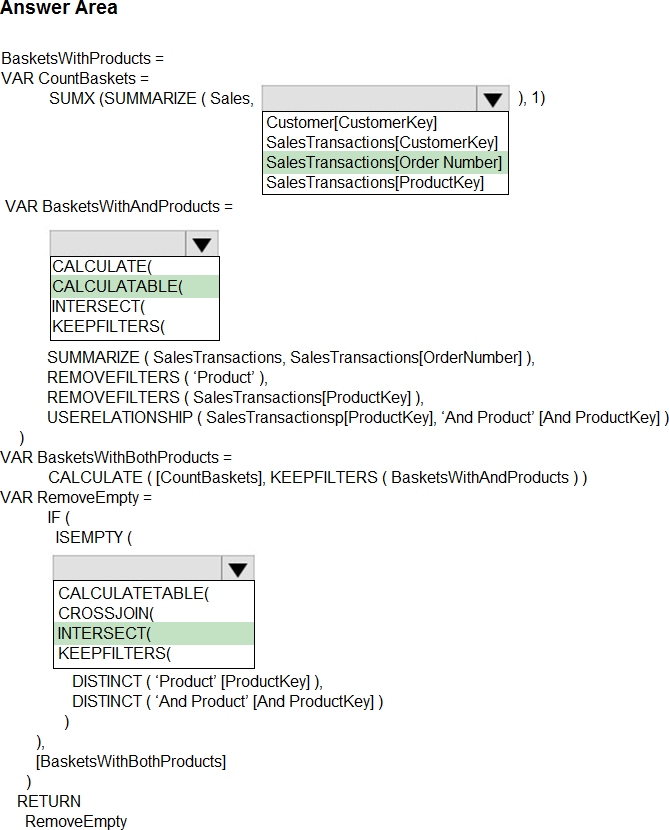
You need to create a measure to count orders for the market basket analysis.
How should you complete the DAX expression? To answer, select the appropriate options in the answer area. NOTE: Each correct selection is worth one point.

Topic 2, Contoso, Ltd
Overview
Contoso, Ltd. is a company that sells enriched financial data to a variety of external customers.
Contoso has a main office in Los Angeles and two branch offices in New York and Seattle.
Data Infrastructure
Contoso has a 50-TB data warehouse that uses an instance of SQL Server on Azure Virtual Machines.
The data warehouse populates an Azure Synapse Analytics workspace that is accessed by the external customers. Currently, the customers can access alt the data.
Contoso has one Power Bl workspace named FinData that contains a single dataset. The dataset
contains financial data from around the world. The workspace is used by 10 internal users and one external customer. The dataset has the following two data sources: the data warehouse and the Synapse Analytics serverless SQL pool.
Users frequently query the Synapse Analytics workspace by using Transact-SQL.
User Problems
Contoso identifies the following user issues:
• Some users indicate that the visuals in Power Bl reports are slow to render when making filter selections.
• Users indicate that queries against the serverless SQL pool fail occasionally because the size of tempdb has been exceeded.
• Users indicate that the data in Power Bl reports is stale. You discover that the refresh process of the Power Bl model occasionally times out
Planned Changes
Contoso plans to implement the following changes:
• Into the existing Power Bl dataset, integrate an external data source that is accessible by using the REST API.
• Build a new dataset in the FinData workspace by using data from the Synapse Analytics dedicated SQL pool.
• Provide all the customers with their own Power Bl workspace to create their own reports. Each workspace will use the new dataset in the FinData workspace.
• Implement subscription levels for the customers. Each subscription level will provide access to specific rows of financial data.
• Deploy prebuilt datasets to Power Bl to simplify the query experience of the customers.
• Provide internal users with the ability to incorporate machine learning models loaded to the dedicated SQL pool.
You need to recommend a solution to add new fields to the financial data Power Bl dataset with data
from the Microsoft SQL Server data warehouse.
What should you include in the recommendation?
- A . Azure Purview
- B . Site-to-Site VPN
- C . an XMLA endpoint
- D . the on-premises data gateway
D
Explanation:
Refresh data from an on-premises SQL Server database
The SQL Server database must be accessed by Power BI through an on-premises data gateway. You can install an on-premises data gateway on the same local computer as SQL Server (in production, it would typically be a different computer).
Reference: https://docs.microsoft.com/en-us/power-bi/connect-data/service-gateway-sql-tutorial
You need to recommend a solution for the customer workspaces to support the planned changes.
Which two configurations should you include in the recommendation? Each correct answer presents part of the solution. NOTE: Each correct selection is worth one point.
- A . Set Use datasets across workspaces to Enabled
- B . Publish the financial data to the web.
- C . Grant the Build permission for the financial data to each customer.
- D . Configure the FinData workspace to use a Power Bl Premium capacity.
AD
Explanation:
Build a new dataset in the FinData workspace by using data from the Synapse Analytics dedicated SQL pool.
Provide all the customers with their own Power BI workspace to create their own reports. Each workspace will use the new dataset in the FinData workspace
Reference: https://docs.microsoft.com/en-us/power-bi/connect-data/service-datasets-admin-across-workspaces
DRAG DROP
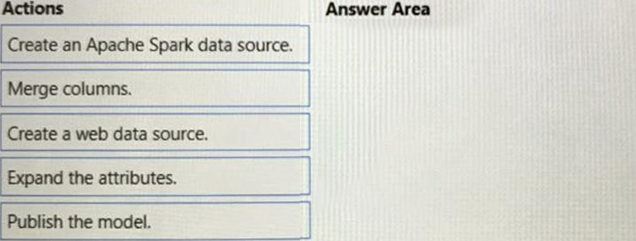
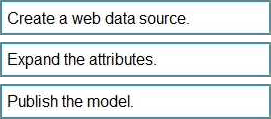
You need to integrate the external data source to support the planned changes.
Which three actions should you perform in sequence? To answer, move the appropriate actions from the list of actions to the answer area and arrange them in the correct order.


DRAG DROP
You need to create Power BI reports that will display data based on the customers’ subscription level.
Which three actions should you perform in sequence? To answer, move the appropriate actions from the list of actions to the answer area and arrange them in the correct order.


Explanation:
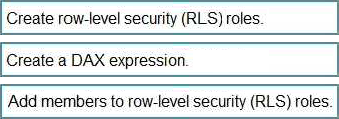
Step 1: Create row-level security (RLS) roles
Create roles
Note: Provide all the customers with their own Power BI workspace to create their own reports. Each workspace will use the new dataset in the FinData workspace. Implement subscription levels for the customers. Each subscription level will provide
access to specific rows of financial data.
Deploy prebuilt datasets to Power BI to simplify the query experience of the customers.
Step 2: Create a DAX expression
Consider a model with two roles: The first role, named Workers, restricts access to all
Payroll table rows by using the following rule expression:
FALSE()
Note: A rule will return no table rows when its expression evaluates to false.
Yet, a second role, named Managers, allows access to all Payroll table rows by using the following rule expression:
TRUE()
Take care: Should a report user map to both roles, they’ll see all Payroll table rows.
Step 3: Add members to row-level security (RLS) roles Configure role mappings
Once [the model is] published to Power BI, you must map members to dataset roles.
Reference: https://docs.microsoft.com/en-us/power-bi/guidance/rls-guidance
You need to identify the root cause of the data refresh issue.
What should you use?
- A . the Usage Metrics Report in powerbi.com
- B . Query Diagnostics in Power Query Editor
- C . Performance analyzer in Power Bl Desktop
B
Explanation:
Users indicate that the data in Power BI reports is stale. You discover that the refresh process of the Power BI model occasionally times out.
With Query Diagnostics, you can achieve a better understanding of what Power Query is doing at authoring and at refresh time in Power BI Desktop. While we’ll be expanding on this feature in the future, including adding the ability to use it during full refreshes, at this time you can use it to understand what sort of queries you’re emitting, what slowdowns you might run into during authoring refresh, and what kind of background events are happening.
Reference: https://docs.microsoft.com/en-us/power-query/querydiagnostics
Which two possible tools can you use to identify what causes the report to render slowly? Each correct answer presents a complete solution. NOTE: Each correct selection is worth one point.
- A . Synapse Studio
- B . DAX Studio
- C . Azure Data Studio
- D . Performance analyzer in Power Bl Desktop
BD
Explanation:
Some users indicate that the visuals in Power BI reports are slow to render when making filter selections.
B: You can investigate a slow query in a Power BI report using DAX Studio, looking at the query plan and the server timings.
D: Use Power BI Desktop Performance Analyzer to optimize the report or model.
Reference:
https://www.sqlbi.com/tv/analyzing-a-slow-report-query-in-dax-studio/
https://docs.microsoft.com/en-us/power-bi/guidance/report-performance-troubleshoot
You need to recommend a solution to resolve the query issue of the serverless SQL pool. The solution must minimize impact on the users.
What should you in the recommendation?
- A . Update the statistics for the serverless SQL pool.
- B . Move the data from the serverless SQL pool to a dedicated Apache Spark pool.
- C . Execute the sp_sec_process_daca_limic stored procedure for the serverless SQL pool.
- D . Move the data from the serverless SQL pool to a dedicated SQL pool.
D
Explanation:
Users indicate that queries against the serverless SQL pool fail occasionally because the size of tempdb has been exceeded.
In the dedicated SQL pool resource, temporary tables offer a performance benefit because their results are written to local rather than remote storage.
Temporary tables in serverless SQL pool.
Temporary tables in serverless SQL pool are supported but their usage is limited. They can’t be used in queries which target files.
For example, you can’t join a temporary table with data from files in storage. The number of temporary tables is limited to 100, and their total size is limited to 100 MB.
Reference: https://docs.microsoft.com/en-us/azure/synapse-analytics/sql/develop-tables-temporary
HOTSPOT
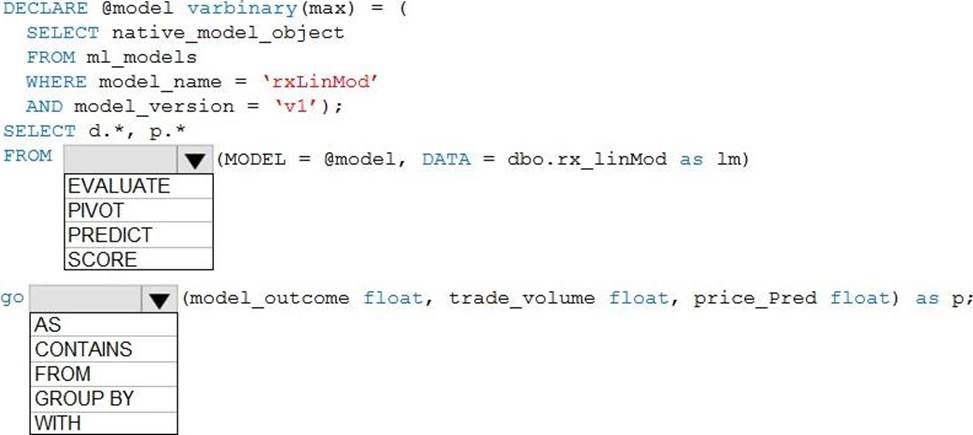
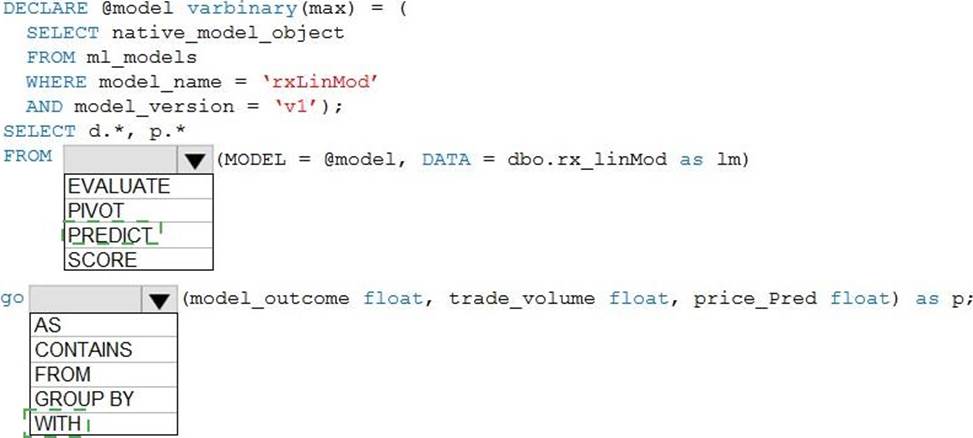
You need to build a Transact-SQL query to implement the planned changes for the internal users.
How should you complete the Transact-SQL query? To answer, select the appropriate options in the answer area. NOTE: Each correct selection is worth one point.


Explanation:
Box 1: PREDICT
Provide internal users with the ability to incorporate machine learning models loaded to the dedicated SQL pool.
The example below shows a sample query using prediction function. An additional column with name Score and data type float is created containing the prediction results. All the input data columns as well as output prediction columns are available to display with the select statement.
— Query for ML predictions SELECT d.*, p.Score
FROM PREDICT(MODEL = (SELECT Model FROM Models WHERE Id = 1), DATA = dbo.mytable AS d, RUNTIME = ONNX) WITH (Score float) AS p;
Box 2: WITH
Reference: https://docs.microsoft.com/en-us/azure/synapse-analytics/sql-data-warehouse/sql-data-warehouse-predict
Topic 3, Fabrikam, Inc.
Overview
Fabrikam, Inc. is a software company that develops educational software for higher education.
Fabrikam has the following business units:
• Finance and Accounting
• Sales and Marketing
• Operations
• Product
The Product business unit contains the following groups:
• User experience designers
• Software engineers
• Product managers
• Testers
The Operations business unit contains an information technology (IT) group. The IT group contains an enterprise analytics team and an information security team.
Fabrikam has three Azure Synapse Analytics workspaces named workspace! prod, workspace 1 test, and workspaceldev. Each workspace is connected to an Azure Data Lake Storage account and contains a lake database that is accessed by using the built-in serverless SQL pool. The data in the Data Lake Storage accounts is available in the lake databases for analysts from every business unit to query and analyze by using Power Bl.
The company imports the following files into the Data Lake Storage accounts:
• User experience data stored as JSON files
• Finance data stored as CSV files
• Sales data stored as CSV files
Fabrikam has a Power Bl tenant that contains 30 workspaces in Pro license mode. The data in the workspaces is a mix of Import and DirectQuery datasets. All reports are interactive.
Fabrikam has three frequently used workspaces as shown in the following table.
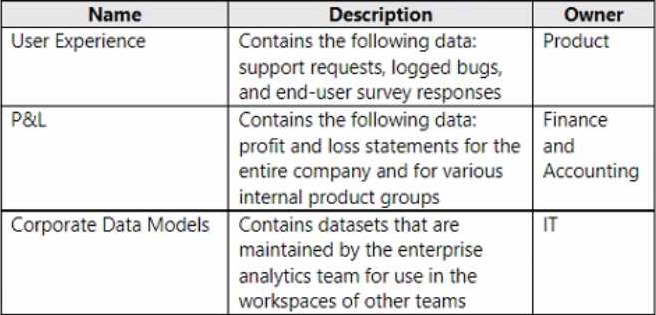

The Corporate Data Models workspace contains a dataset named Financial Model that is used by reports in the P&L workspace. Financial Model is maintained by the enterprise analytics team. The Corporate Data Models workspace and the User Experience workspace have corresponding development and test workspaces.
Administrators report an increase in the maintenance of Power Bl tenant assets due to analysts in the Finance and Accounting business unit who create new Power Bl datasets when the existing datasets already meet their needs.
Analysts in the Product business unit report the following issues:
• Datasets are published to the User Experience workspace, while the data sources reference workspace! test.
• The parsing of user experience data in Power Query is very slow.
The enterprise analytics team identifies two DAX measures in the Financial Model dataset that are consistently slow to execute. The team must identify all the reports that use the Financial Model dataset and notify the report owners of changes to the measures.
Members of the enterprise analytics team report that creating Power Bl reports and adjusting tables and views in Azure Synapse is tedious because they must switch between the Power Bl workspaces and the Azure Synapse workspaces.
The information security team identifies that the user experience data is being shared externally.
Fabrikam plans to implement the following changes:
• Power Bl will be registered as a data source in Microsoft Purview.
• The analysts in the Product business unit will create a more automated process for deploying Power Bl reports and datasets to the User Experience workspace.
The enterprise analytics team plans to perform the following tasks:
• Update the DAX calculations in the Financial Model dataset.
• Create views in the Azure Synapse workspaces to speed up the parsing of user experience data.
• Create and document the change management process for shared Power Bl datasets.
From Microsoft Purview, analysts in all the business units must be able to see all the assets in the Power Bl tenant and the Azure Synapse workspaces. Power Bl asset information must include lineage to identify the data sources used by each report.
The information security team must identify all the Power Bl reports and datasets that contain Personally Identifiable Information (Pll).
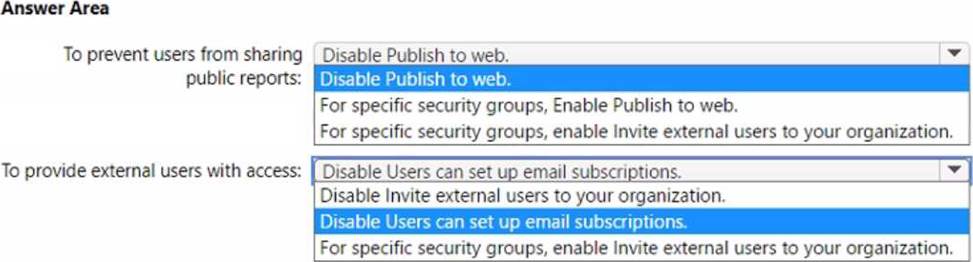
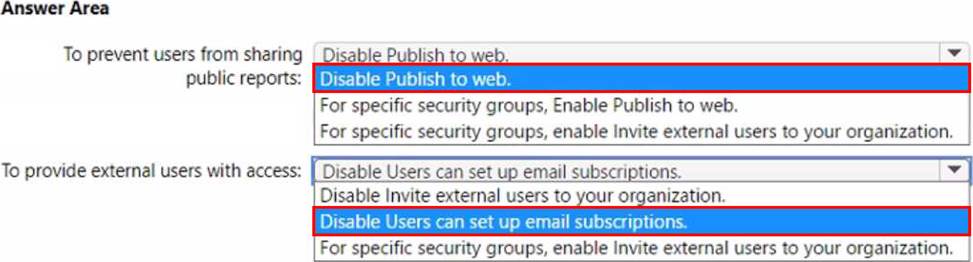
Fabrikam requires a security solution for the Power Bl tenant.
The solution must meet the following requirements:
• Access to the tenant by external users must be approved by a manager and granted by the IT group.
• The external users must be prevented from publishing or modifying content in the tenant
• Users must be prevented from sharing Power Bl reports publicly to the internet.
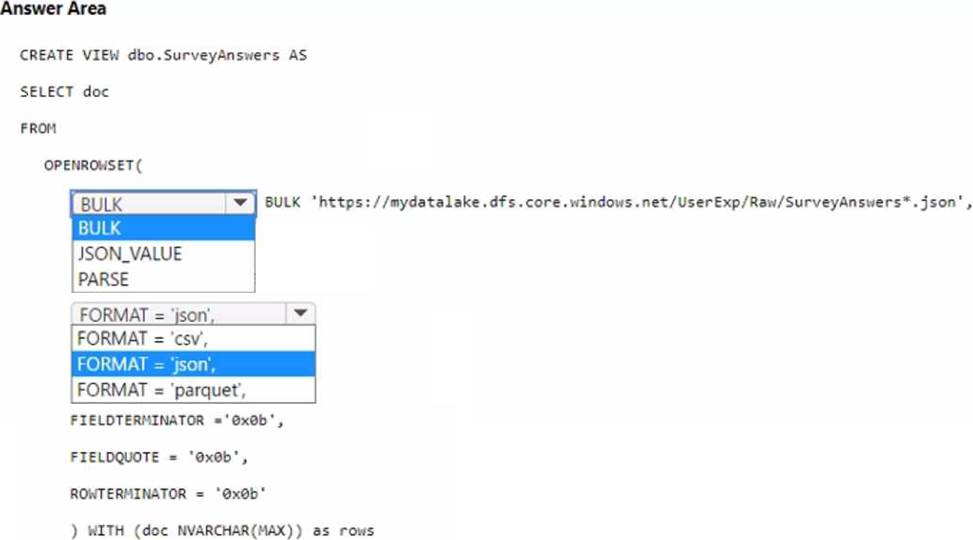
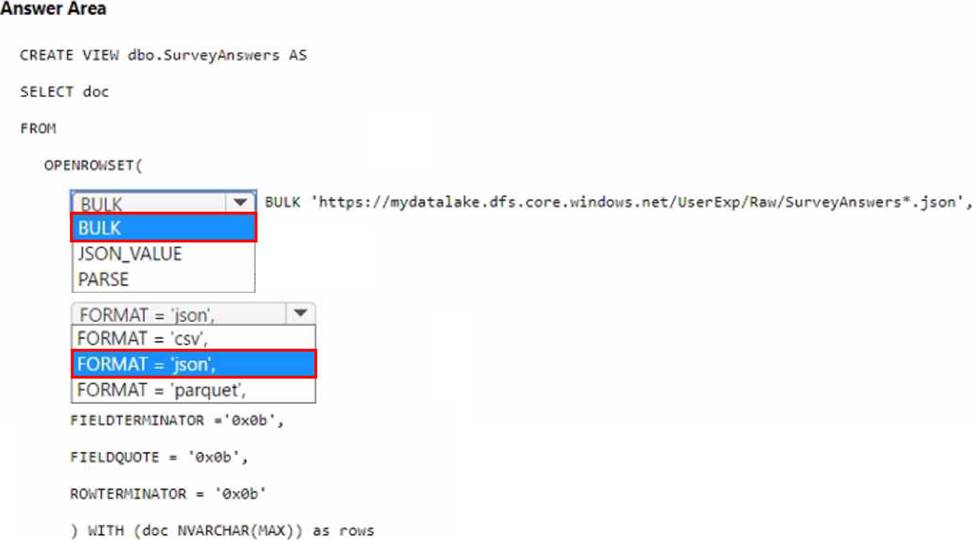
The new process for deploying Power Bl reports and datasets to the User Experience workspace must ensure that the datasets point to the lake database to which the relevant dataset is deployed. The views in each lake database must present the data in a tabular format.
The enterprise analytics team needs to notify the report owners of the planned changes. The solution must minimize administrative effort.
What should the team do?
- A . Locate all the downstream reports, identify all the users That are assigned the Admin role, and then send an email to each user.
- B . Write a PowerShell script to access the Power Bl API that retrieves a list of downstream reports and a list of workspace administrators, and then send an email to each workspace administrator.
- C . Perform impact analysis on the Financial Model dataset to notify the workspace contacts.
- D . Perform impact analysis feature on the lake database data source to notify the workspace contacts.
You need to recommend a solution for the analysts in the Finance and Accounting business unit to mitigate the increase in maintenance of their assets in the Power Bl tenant.
Which two actions should you recommend? Each correct answer presents part of the solution. NOTE: Each correct selection is worth one point.
- A . Use Microsoft Purview to search for datasets that contain the relevant data.
- B . Perform impact analysis on the relevant data source.
- C . Create a live connection to a Power Bl dataset.
- D . Create a Power Bl template app.
HOTSPOT
You need to recommend a security solution for the Power Bl tenant to control external data sharing.
The solution must meet the technical requirements.
What should you recommend? To answer, select the appropriate options in the answer area. NOTE: Each correct selection is worth one point.

HOTSPOT
The enterprise analytics team needs to create a view for the survey response data. The solution must meet the technical requirements.
How should you complete the code? To answer, select the appropriate options in the answer area. NOTE: Each correct selection is worth one point.

DRAG DROP
You need to ensure that the new process for deploying reports and datasets to the User Experience workspace meets the technical requirements.
Which three actions should you perform in sequence? To answer, move the appropriate actions from the list of actions to the answer area and arrange them in the correct order.

The enterprise analytics team needs to resolve the DAX measure performance issues.
What should the team do first?
- A . Use Performance analyzer in Power Bl Desktop to get the DAX durations.
- B . Use DAX Studio to get detailed statistics on the server timings.
- C . Use DAX Studio to review the Vertipaq Analyzer metrics.
- D . Use Tabular Editor to create calculation groups.
You need to optimize the workflow for the creation of reports and the adjustment of tables by the enterprise analytics team.
What should you do?
- A . Add a tenant-level storage connection to Power Bl
- B . Create a linked service in workspace1.
- C . Create an integration runtime in workspace1.
- D . From the Tenant setting, enable Use global search for Power BL
You need to meet the technical requirements for deploying reports and datasets to the User Experience workspace.
What should you do?
- A . From the Corporate Data Models and User Experience workspaces, select Allow contributors to update the app.
- B . From the Corporate Data Models and User Experience workspace, set License mode to Premium per user
- C . From the Tenant settings, set Allow specific users to turn on external data sharing to Enable.
- D . From the Developer settings, set Allow service principals to use Power Bl APIs to Enable.
You need to recommend changes to the Power Bl tenant to meet the technical requirements for external data sharing.
Which tenant setting should you recommend disabling?
- A . Allow shareable links to grant access to everyone in your organization
- B . Allow Azure Active Directory guest users to edit and manage content in the organization
- C . Users can reassign personal workspaces
- D . Show Azure Active Directory guests in lists of suggested people
The group registers the Power Bl tenant as a data source1.
You need to ensure that all the analysts can view the assets in the Power Bl tenant The solution must meet the technical requirements for Microsoft Purview and Power BI.
What should you do?
- A . Create a scan.
- B . Deploy a Power Bl gateway.
- C . Search the data catalog.
- D . Create a linked service.
Topic 4, Misc. Questions
You develop a solution that uses a Power Bl Premium capacity. The capacity contains a dataset that is expected to consume 50 GB of memory.
Which two actions should you perform to ensure that you can publish the model successfully to the Power Bl service? Each correct answer presents part of the solution. NOTE: Each correct selection is worth one point.
- A . Increase the Max Offline Dataset Size setting.
- B . Invoke a refresh to load historical data based on the incremental refresh policy.
- C . Restart the capacity.
- D . Publish an initial dataset that is less than 10 GB.
- E . Publish the complete dataset.
BE
Explanation:
Enable large datasets
Steps here describe enabling large datasets for a new model published to the service. For existing datasets, only step 3 is necessary.
Create a model in Power BI Desktop. If your dataset will become larger and progressively consume more memory, be sure to configure Incremental refresh.
Publish the model as a dataset to the service.
In the service > dataset > Settings, expand Large dataset storage format, set the slider to On, and then select Apply.
Enable large dataset slider
Invoke a refresh to load historical data based on the incremental refresh policy. The first refresh could take a while to load the history. Subsequent refreshes should be faster, depending on your incremental refresh policy.
Reference: https://docs.microsoft.com/en-us/power-bi/enterprise/service-premium-large-models
DRAG DROP
You have a Power Bl dataset that contains the following measures:
• Budget
• Actuals
• Forecast
You create a report that contains 10 visuals.
You need provide users with the ability to use a slicer to switch between the measures in two visuals only.
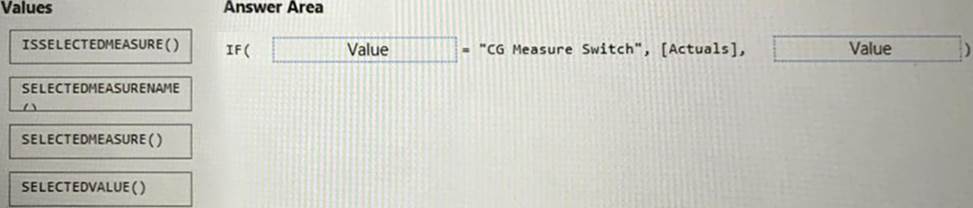
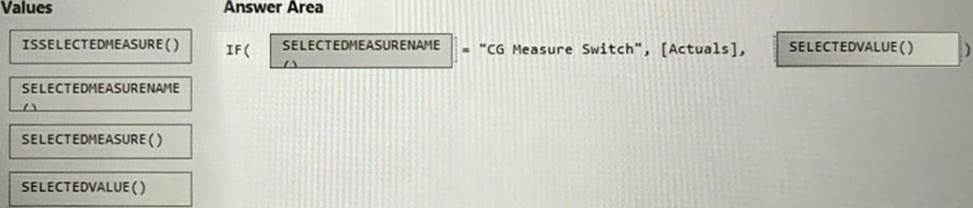
You create a dedicated measure named cg Measure switch.
How should you complete the DAX expression for the Actuals measure? To answer, drag the appropriate values to the targets. Each value may be used once, more than once, or not at all. You may need to drag the split bar between panes or scroll to view content. NOTE: Each correct selection is worth one point.

Explanation:
Box 1: SELECTEDMEASURENAME()
SELECTEDMEASURENAME is used by expressions for calculation items to determine the measure that is in context by name.
Syntax: SELECTEDMEASURENAME()
No parameters.
Example:
The following calculation item expression checks if the current measure is Expense Ratio and conditionally applies calculation logic. Since the check is based on a string comparison, it is not subject to formula fixup and will not benefit from object renaming being automatically reflected. For a similar comparison that would benefit from formula fixup, please see the ISSLECTEDMEASURE function instead.
IF (
SELECTEDMEASURENAME = "Expense Ratio",
SELECTEDMEASURE (),
DIVIDE ( SELECTEDMEASURE (), COUNTROWS ( DimDate ) )
)
Box 2: SELECTEDVALUE()
SELECTEDVALUE returns the value when the context for columnName has been filtered down to one distinct value only. Otherwise returns alternateResult.
Syntax:
SELECTEDVALUE(<columnName>[, <alternateResult>])
M1, M2, … – A list of measures.
Reference:
https://docs.microsoft.com/en-us/dax/selectedmeasurename-function-dax
https://docs.microsoft.com/en-us/dax/selectedvalue-function
You have a Power Bi workspace named Workspacel in a Premium capacity. Workspacel contains a dataset.
During a scheduled refresh, you receive the following error message: "Unable to save the changes since the new dataset size of 11,354 MB exceeds the limit of 10,240 MB."
You need to ensure that you can refresh the dataset.
What should you do?
- A . Turn on Large dataset storage format.
- B . Connect Workspace1 to an Azure Data Lake Storage Gen2 account
- C . Change License mode to Premium per user.
- D . Change the location of the Premium capacity.
D
Explanation:
Assigning workspaces to capacities
Workspaces can be assigned to a Premium capacity in the Power BI Admin portal or, for a workspace, in the Workspace pane.
Note: Capacity limits
Workspace storage limits, whether for My Workspace or an app workspace, depend on whether the workspace is in shared or Premium capacity.
* Shared capacity limits
For workspaces in shared capacity:
There is a per-workspace storage limit of 10 GB.
Premium Per User (PPU) tenants have a 100 TB storage limit.
When using a Pro license, the total usage can’t exceed the tenant storage limit of 10 GB multiplied by the number of Pro licenses in the tenant.
* Premium capacity limits
For workspaces in Premium capacity:
There is a limit of 100 TB per Premium capacity.
There is no per-user storage limit.
Workspace storage usage is shown as 0 (as shown in this screenshot) if the workspace is assigned to a Premium capacity.
Incorrect:
Not C: If your organization is using the original version of Power BI Premium, you’re required to migrate to the modern Premium Gen2 platform. Microsoft began migrating all Premium capacities to Gen2.
Reference:
https://docs.microsoft.com/en-us/power-bi/enterprise/service-premium-capacity-manage-gen2
https://docs.microsoft.com/en-us/power-bi/admin/service-admin-manage-your-data-storage-in-power-bi
You have a dataset that contains a table named UserPermissions. UserPermissions contains the following data.
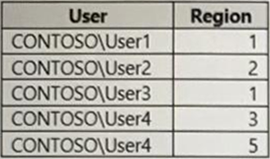

You plan to create a security role named User Security for the dataset. You need to filter the dataset based on the current users.
What should you include in the DAX expression?
- A . [UserPermissions] – USERNAME()
- B . [UserPermissions] – USERPRINCIPALNAME()
- C . [User] = USERPRINCIPALNAME()
- D . [User] = USERNAME()
- E . [User] = USEROBJECTID()
D
Explanation:
USERNAME() returns the domain name and username from the credentials given to the system at connection time.
It should be compared to column name of User, which in DAX is expressed through [User].
Reference: https://docs.microsoft.com/en-us/dax/username-function-dax
You have a Power Bl dataset that uses DirectQuery against an Azure SQL database.
Multiple reports use the dataset.
A database administrator reports that too many queries are being sent from Power Bl to the database.
You need to reduce the number of queries sent to the database.
The solution must meet the following requirements:
• DirectQuery must continue to be used.
• Visual interactions in all the reports must remain as they are configured currently.
• Consumers of the reports must only be allowed to apply filters from the Filter pane.
Which two settings should you select? Each correct answer presents part of the solution. NOTE: Each correct selection is worth one point.
- A . Disabling cross highlighting/filtering by default
- B . Add a single Apply button to the filter pane to apply changes at once
- C . Add an Apply button to each slicer to apply changes when you’re ready
- D . Add Apply buttons to all basic filters to apply changes when you’re ready
- E . Ignore the Privacy Levels and potentially improve performance
BC
Explanation:
Reduce queries
Reduce the number of queries sent by Power BI using the Query reduction settings. For slicers, select the “Add an Apply button to each slicer to apply changes when you’re ready” option. For filters, select “Add a single Apply button to the filter pane to apply changes at once (preview).”
Reference: https://maqsoftware.com/insights/power-bi-best-practices
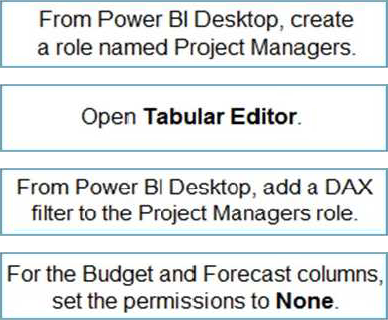
DRAG DROP
You have a Power Bl dataset that contains two tables named Table1 and Table2. The dataset is used by one report.
You need to prevent project managers from accessing the data in two columns in Table1 named Budget and Forecast.
Which four actions should you perform in sequence? To answer, move the appropriate actions from the list of actions to the answer area and arrange them in the correct order.
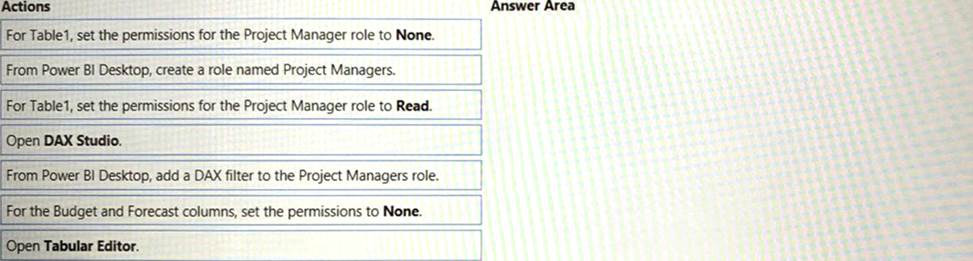


Explanation:
Step 1: From Power BI Desktop, create a role named Project Managers.
Create roles
You can define roles within Power BI Desktop.
Step 2: Open Tabular Editor
Under Tables, select the table to which you want to apply a DAX rule.
In the Table filter DAX expression box, enter the DAX expressions. This expression returns a value of true or false. For example: [Entity ID] = “Value”.
Step 3: From Power BI Desktop, add a DAX filter to the Project Managers role.
Step 4: For Table1, the Budget and Forecast columns, set the permissions to None.
Reference: https://docs.microsoft.com/en-us/power-bi/guidance/rls-guidance
You have a Power Bl data model.
You need to refresh the data from the source every 15 minutes.
What should you do first?
- A . Enable the XMLA endpoint.
- B . Define an incremental refresh policy.
- C . Change the storage mode of the dataset.
- D . Configure a scheduled refresh.
D
Explanation:
You cannot schedule a refresh on 15-minute increments. Only 30, unless using XMLA endpoint.
HOTSPOT
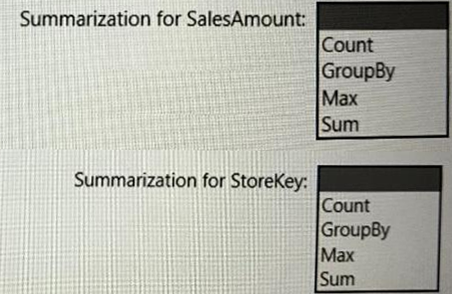
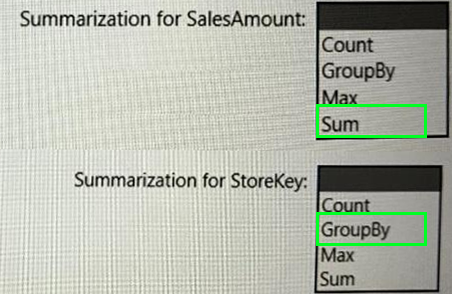
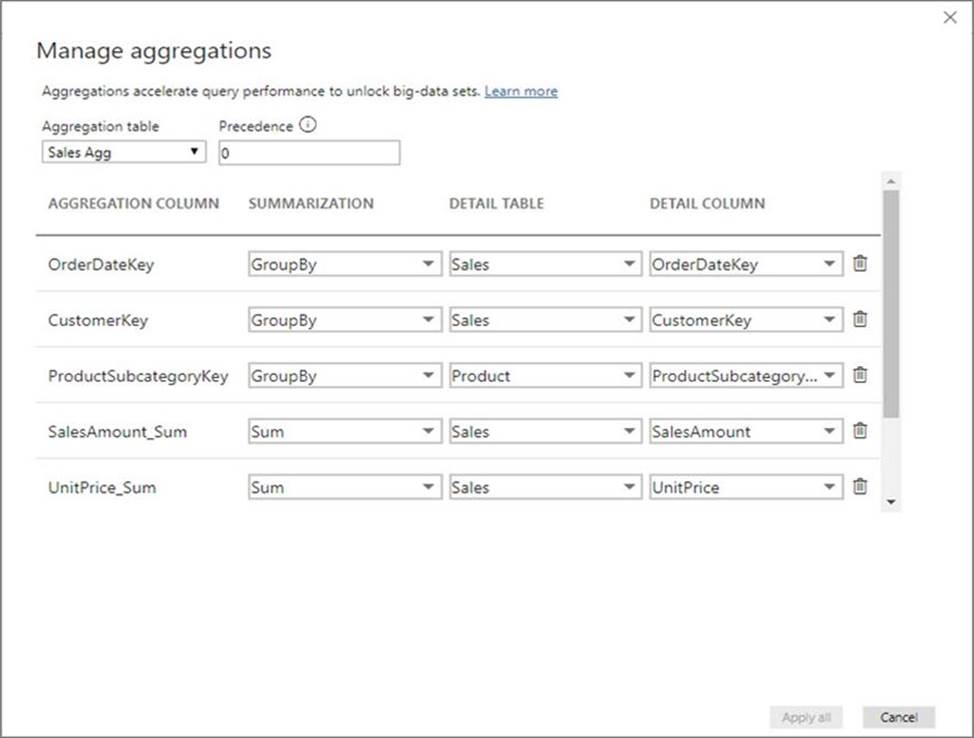
You are configuring an aggregation table as shown in the following exhibit.
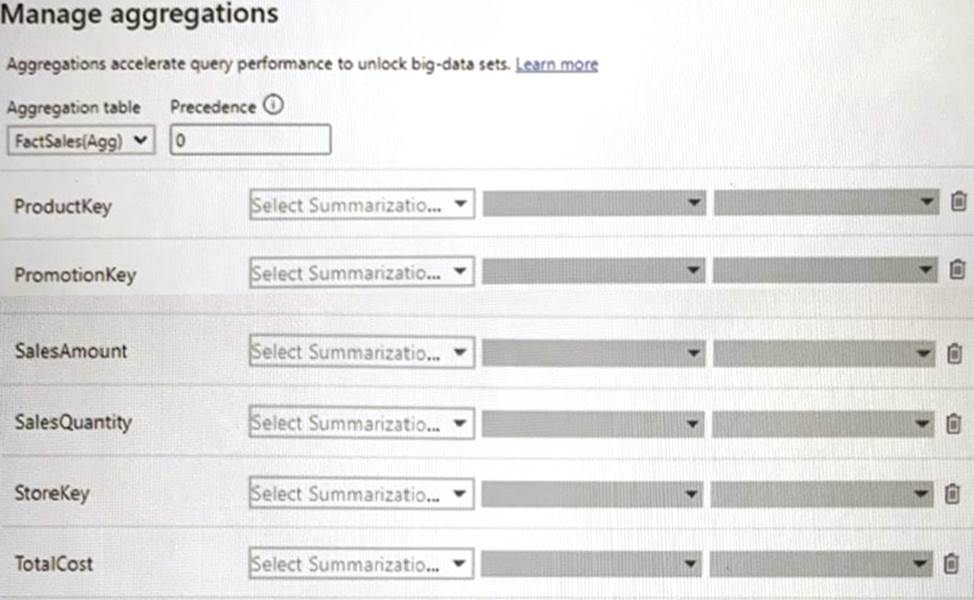

The detail table is named FactSales and the aggregation table is named FactSales(Agg).
You need to aggregate SalesAmount for each store.
Which type of summarization should you use for SalesAmount and StoreKey? To answer, select the appropriate options in the answer area. NOTE: Each correct selection is worth one point.

Explanation:
Box 1: Sum
The Manage aggregations dialog shows a row for each column in the table, where you can specify the aggregation behavior. In the following example, queries to the Sales detail table are internally redirected to the Sales Agg aggregation table.

Box 2: GroupBy
Reference: https://docs.microsoft.com/en-us/power-bi/transform-model/aggregations-advanced
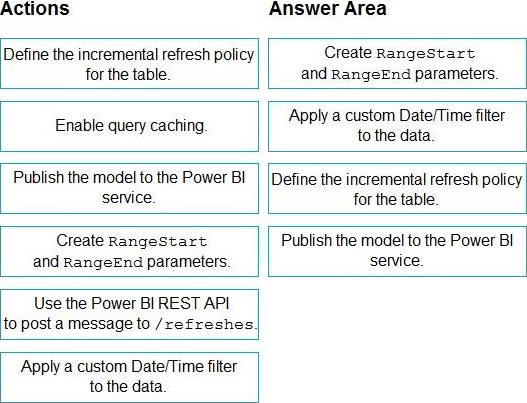
DRAG DROP
You have a Power Bl dataset. The dataset contains data that is updated frequently.
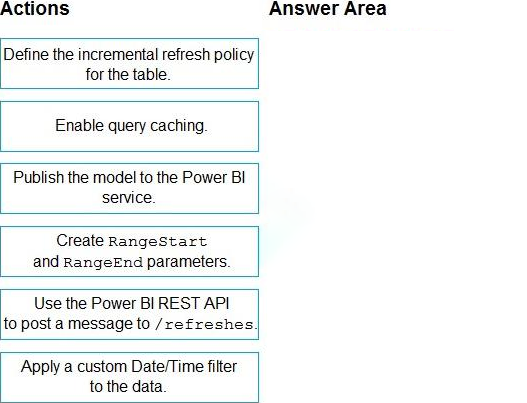
You need to improve the performance of the dataset by using incremental refreshes.
Which four actions should you perform in sequence to enable the incremental refreshes? To answer, move the appropriate actions from the list of actions to the answer area and arrange them in the correct order.

Explanation:
Step 1: Create RangeStart and RangeEnd parameters.
Create parameters
In this task, use Power Query Editor to create RangeStart and RangeEnd parameters with default values. The default values apply only when filtering the data to be loaded into the model in Power BI Desktop. The values you enter should include only a small amount of the most recent data from your data source. When published to the service, these values are overridden by the incremental refresh policy.
Step 2: Apply a custom Date/Time filter to the data.
Filter data
With RangeStart and RangeEnd parameters defined, apply a filter based on conditions in the RangeStart and RangeEnd parameters.
Before continuing with this task, verify your source table has a date column of Date/Time data type.
Step 3: Define the incremental refresh policy for the table.
Define policy
After you’ve defined RangeStart and RangeEnd parameters, and filtered data based on those parameters, you define an incremental refresh policy. The policy is applied only after the model is published to the service and a manual or scheduled refresh operation is performed.
Step 4: Publish the model to the Power BI service.
Save and publish to the service
When your RangeStart and RangeEnd parameters, filtering, and refresh policy settings are complete, be sure to save your model, and then publish to the service.
Reference: https://docs.microsoft.com/en-us/power-bi/connect-data/incremental-refresh-configure
You are configuring a Power Bl report for accessibility as shown in the following table.

You need to change the default colors of all three visuals to make the report more accessible to users who have color vision deficiency.
Which two settings should you configure in the Customize theme window? Each correct answer presents part of the solution. NOTE: Each correct selection is worth one point.
- A . Theme colors
- B . Sentiment colors
- C . Divergent colors
- D . First-level elements colors
AB
Explanation:
Reference: https://docs.microsoft.com/en-us/power-bi/create-reports/desktop-report-themes
You are creating a Python visual in Power Bl Desktop.
You need to retrieve the value of a column named Unit Price from a DataFrame.
How should you reference the Unit Price column in the Python code?
- A . pandas.DataFrame(‘Unit Price’)
- B . dataset[‘Unit Price’]
- C . data = [Unit Price]
- D . (‘Unit Price’)
A
Explanation:
You can retrieve a column in a pandas DataFrame object by using the DataFrame object name, followed by the label of the column name in brackets.
So if the DataFrame object name is dataframe1 and the column we are trying to retrieve the ‘X’ column, then we retrieve the column using the statement, dataframe1[‘X’].
Here’s a simple Python script that imports pandas and uses a data frame:
import pandas as pd
data = [[‘Alex’,10],[‘Bob’,12],[‘Clarke’,13]]
df = pd.DataFrame(data,columns=[‘Name’,’Age’],dtype=float)
print (df)
When run, this script returns:
Name Age
0 Alex 10.0
1 Bob 12.0
2 Clarke 13.0
Reference: http://www.learningaboutelectronics.com/Articles/How-to-retrieve-a-column-from-a-pandas-dataframe-object-in-Python.php
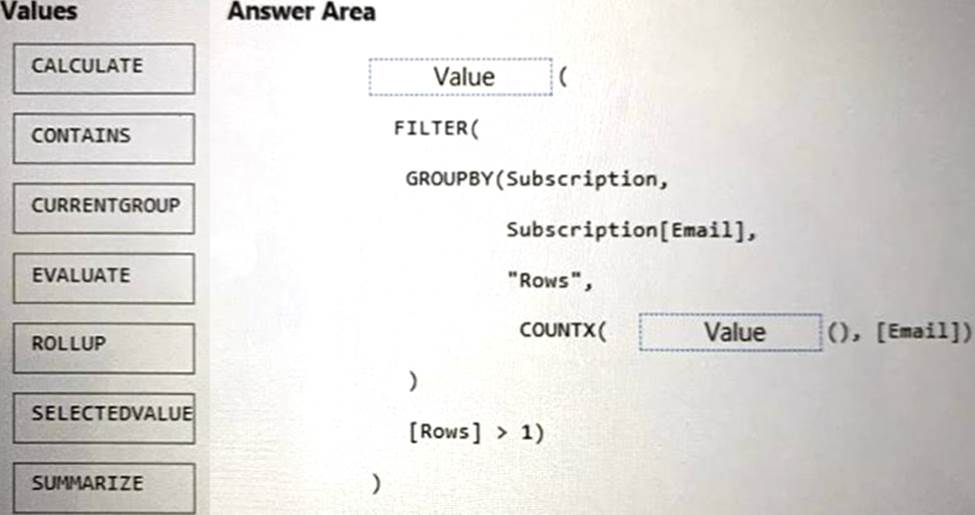
DRAG DROP
You are using DAX Studio to query an XMLA endpoint.
How should you complete the DAX expression? To answer, drag the appropriate values to the targets. Each value may be used once, more than once. may need to drag the split bar between panes or scroll to view content. NOTE: Each correct selection is worth one point.


Explanation:
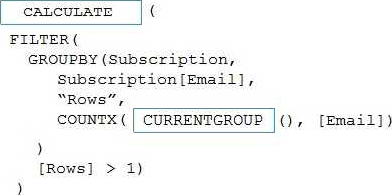
Box 1: CALCULATE
Box 2: CURRENTGROUP
CURRENTGROUP returns a set of rows from the table argument of a GROUPBY expression that belong to the current row of the GROUPBY result.
Remarks
This function can only be used within a GROUPBY expression.
This function takes no arguments and is only supported as the first argument to one of the following aggregation functions: AVERAGEX, COUNTAX, COUNTX, GEOMEANX, MAXX, MINX, PRODUCTX,
STDEVX.S, STDEVX.P, SUMX, VARX.S, VARX.P.
Note: COUNTX counts the number of rows that contain a non-blank value or an expression that evaluates to a non-blank value, when evaluating an expression over a table.
Reference: https://docs.microsoft.com/en-us/dax/currentgroup-function-dax
HOTSPOT
You have the following code in an Azure Synapse notebook.


Use the drop-down menus to select the answer choice that completes each statement based on the information presented in the code. NOTE: Each correct selection is worth one point.


Explanation:
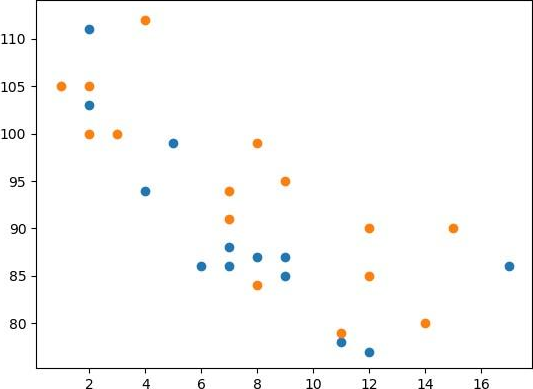
Box 1: three scatterplots
Compare Plots
Example, Draw two plots on the same figure:
import matplotlib.pyplot as plt
import numpy as np
#day one, the age and speed of 13 cars:
x = np.array([5,7,8,7,2,17,2,9,4,11,12,9,6])
y = np.array([99,86,87,88,111,86,103,87,94,78,77,85,86])
plt.scatter(x, y)
#day two, the age and speed of 15 cars:
x = np.array([2,2,8,1,15,8,12,9,7,3,11,4,7,14,12])
y = np.array([100,105,84,105,90,99,90,95,94,100,79,112,91,80,85])
plt.scatter(x, y)
plt.show()
Result:

Box 2: three marker symbols
One for each scatterplot. One default, and two defined.
Default is point.
v is triangle down.
^ is triangle up.
Reference:
https://www.w3schools.com/python/matplotlib_scatter.asp
https://matplotlib.org/stable/api/markers_api.html
HOTSPOT
You have the following code in an Azure Synapse notebook.


Use the drop-down menus to select the answer choice that completes each statement based on the information presented in the code. NOTE: Each correct selection is worth one point.

Explanation:
Box 1: stacked bar chart
matplotlib.pyplot.bar makes a bar plot.
The bars are positioned at x with the given alignment. Their dimensions are given by height and width. The vertical baseline is bottom (default 0).
Many parameters can take either a single value applying to all bars or a sequence of values, one for each bar.
Stacked bars can be achieved by passing individual bottom values per bar.
Stacked bar chart
This is an example of creating a stacked bar plot with error bars using bar. Note the parameters yeer used for error bars, and bottom to stack the women’s bars on top of the men’s bars.
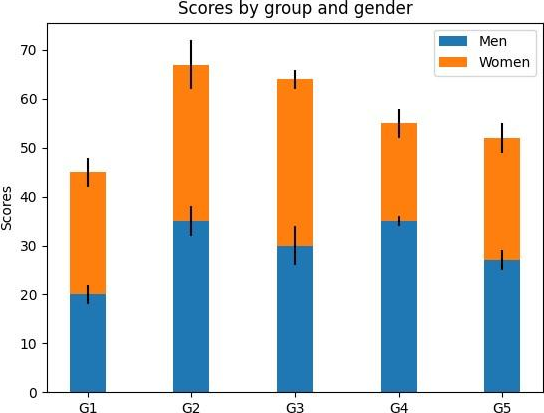

import matplotlib.pyplot as plt
labels = [‘G1’, ‘G2’, ‘G3’, ‘G4’, ‘G5’]
men_means = [20, 35, 30, 35, 27]
women_means = [25, 32, 34, 20, 25]
men_std = [2, 3, 4, 1, 2]
women_std = [3, 5, 2, 3, 3]
width = 0.35 # the width of the bars: can also be len(x) sequence
fig, ax = plt.subplots()
ax.bar(labels, men_means, width, yerr=men_std, label=’Men’)
ax.bar(labels, women_means, width, yerr=women_std, bottom=men_means, label=’Women’)
ax.set_ylabel(‘Scores’)
ax.set_title(‘Scores by group and gender’)
ax.legend()
plt.show()
Box 2: two items
Blue item and Green Item.
matplotlib.legend
The legend module defines the Legend class, which is responsible for drawing legends associated with axes and/or figures.
Note: A Diagram Legend is an element that you can add to your diagram to provide information about the colors and/or line thicknesses and styles that have been used in the current diagram, where those colors and other styles have some particular meaning.
https://matplotlib.org/stable/gallery/lines_bars_and_markers/bar_stacked.html
https://matplotlib.org/stable/api/legend_api.html
You have a Power Bl report that contains one visual.
You need to provide users with the ability to change the visual type without affecting the view for other users.
What should you do?
- A . From Report setting, select Personalize visuals.
- B . From Tabular Editor, create a new perspective.
- C . From the Bookmarks pane, select Focus mode, and then select Add.
- D . From Visual options in Report settings, select Use the modern visual header with updated styling options.
A
Explanation:
Enable personalization in a report
You can enable the feature either in Power BI Desktop or the Power BI service. You can also enable it in embedded reports.
To enable the feature in Power BI Desktop, go to File > Options and settings > Options > Current file > Report settings. Make sure Personalize visuals is turned on.
You have a Power Bl report that contains the visual shown in the following exhibit.
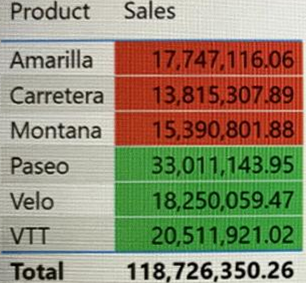

You need to make the visual more accessible to users who have color vision deficiency.
What should you do?
- A . Change the font color of values in the Sales column to white.
- B . Change the red background color to orange.
- C . Add icons to represent the sales status of each product.
- D . Add additional measures to the table values.
A
Explanation:
Themes, contrast and colorblind-friendly colors
You should ensure that your reports have enough contrast between text and any background colors. Certain color combinations are particularly difficult for users with color vision deficiencies to distinguish.
These include the following combinations:
**—> green and black
green and red
green and brown
blue and purple
green and blue
light green and yellow
blue and grey
green and grey
Avoid using these colors together in a chart, or on the same report page.
Reference: https://docs.microsoft.com/en-us/power-bi/create-reports/desktop-accessibility-creating-reports
HOTSPOT
You are creating a Power Bl Desktop report.
You add a Python visual to the report page.
You plan to create a scatter chart to visualize the data.
You add Python code to the Python script editor.
You need to create the scatter chart.
How should you complete the Python code? To answer, select the appropriate options in the answer area. NOTE: Each correct selection is worth one point.


Explanation:
Box 1: matplotlib.pyplot
Create a scatter plot
Let’s create a scatter plot to see if there’s a correlation between age and weight.
Under Paste or type your script code here, enter this code:
import matplotlib.pyplot as plt
dataset.plot(kind=’scatter’, x=’Age’, y=’Weight’, color=’red’)
plt.show()
Box 2: chart.show()
Reference: https://docs.microsoft.com/en-us/power-bi/connect-data/desktop-python-visuals#create-a-scatter-plot
You have the following Python code in an Apache Spark notebook.


Which type of chart will the code produce?
- A . a stacked bar chart
- B . a pie chart
- C . a bar chart
- D . an area chart
D
Explanation:
The matplotlib.pyplot.fill_between function fills the area between two horizontal curves.
The curves are defined by the points (x, y1) and (x, y2). This creates one or multiple polygons describing the filled area.
Reference: https://matplotlib.org/3.5.0/api/_as_gen/matplotlib.pyplot.fill_between.html
You use Azure Synapse Analytics and Apache Spark notebooks to You need to use PySpark to gain access to the visual libraries.
Which Python libraries should you use?
- A . Seaborn only
- B . Matplotlib and Seaborn
- C . Matplotlib only
- D . Matplotlib and TensorFlow
- E . TensorFlow only
- F . Seaborn and TensorFlow
B
Explanation:
Matplotlib
You can render standard plotting libraries, like Matplotlib, using the built-in rendering functions for each library.
Matplotlib is a plotting library for the Python programming language and its numerical mathematics extension NumPy.
Additional libraries
Beyond these libraries, the Azure Synapse Analytics Runtime also includes the following set of libraries that are often used for data visualization:
Seaborn
Seaborn is a Python data visualization library based on matplotlib. It provides a high-level interface for drawing attractive and informative statistical graphics.
Reference:
https://docs.microsoft.com/en-us/azure/synapse-analytics/spark/apache-spark-data-visualization
https://seaborn.pydata.org/
You are using a Python notebook in an Apache Spark pool in Azure Synapse Analytics. You need to present the data distribution statistics from a DataFrame in a tabular view.
Which method should you invoke on the DataFrame?
- A . freqltems
- B . explain
- C . rollup
- D . describe
D
Explanation:
The aggregating statistic can be calculated for multiple columns at the same time with the describe function.
Example:
titanic[["Age", "Fare"]].describe()
Out[6]:
Age Fare
count 714.000000 891.000000
mean 29.699118 32.204208
Reference: https://pandas.pydata.org/docs/getting_started/intro_tutorials/06_calculate_statistics.html
You have a kiosk that displays a Power Bl report page. The report uses a dataset that uses Import storage mode. You need to ensure that the report page updates all the visuals every 30 minutes.
Which two actions should you perform? Each correct answer presents part of the solution. NOTE: Each correct selection is worth one point.
- A . Enable Power Bl embedded.
- B . Configure the data sources to use DirectQuery.
- C . Configure the data sources to use a streaming dataset
- D . Select Auto page refresh.
- E . Enable the XMIA endpoint.
- F . Add a Microsoft Power Automate visual to the report page.
BD
Explanation:
Automatic page refresh in Power BI enables your active report page to query for new data, at a predefined cadence, for DirectQuery sources.
Automatic page refresh is available for DirectQuery sources and some LiveConnect scenarios, so it will only be available when you are connected to a supported data source. This restriction applies to both automatic page refresh types.
Reference: https://docs.microsoft.com/en-us/power-bi/create-reports/desktop-automatic-page-refresh
You have an Azure Synapse Analytics dedicated SQL pool.
You need to ensure that the SQL pool is scanned by Azure Purview.
What should you do first?
- A . Register a data source.
- B . Search the data catalog.
- C . Create a data share connection.
- D . Create a data policy.
You have a Power Bl workspace that contains one dataset and four reports that connect to the dataset.
The dataset uses Import storage mode and contains the following data sources:
• A CSV file in an Azure Storage account
• An Azure Database for PostgreSQL database
You plan to use deployment pipelines to promote the content from development to test to production. There will be different data source locations for each stage.
What should you include in the deployment pipeline to ensure that the appropriate data source locations are used during each stage?
- A . parameter rules
- B . selective deployment
- C . auto-binding across pipelines
- D . data source rules
A
Explanation:
Note: Create deployment rules
When working in a deployment pipeline, different stages may have different configurations. For example, each stage can have different databases or different query parameters. The development stage might query sample data from the database, while the test and production stages query the entire database.
When you deploy content between pipeline stages, configuring deployment rules enables you to allow changes to content, while keeping some settings intact. For example, if you want a dataset in a production stage to point to a production database, you can define a rule for this. The rule is defined in the production stage, under the appropriate dataset. Once the rule is defined, content deployed from test to production, will inherit the value as defined in the deployment rule, and will always apply as long as the rule is unchanged and valid.
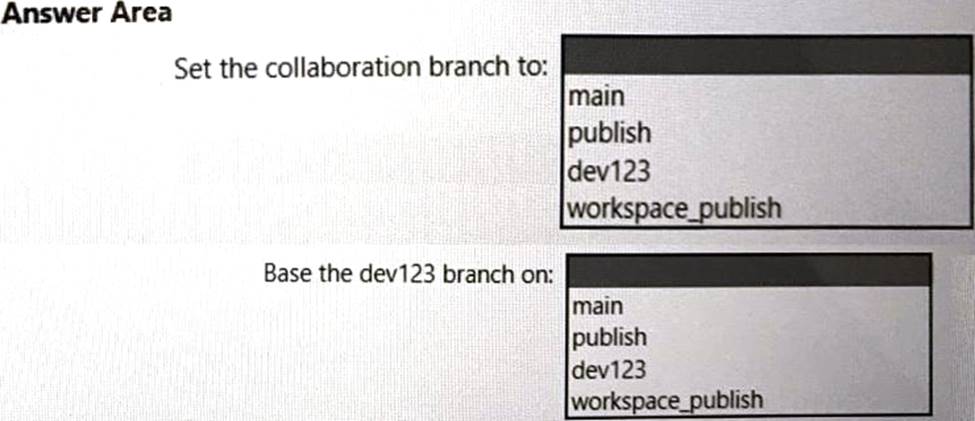
HOTSPOT
You need to configure a source control solution for Azure Synapse Analytics.
The solution must meet the following requirements:
• Code must always be merged to the main branch before being published, and the main branch must be used for publishing resource
• The workspace templates must be stored in the publish branch.
• A branch named dev123 will be created to support the development of a new feature.
What should you do? To answer, select the appropriate options in the answer area. NOTE: Each correct selection is worth one point.

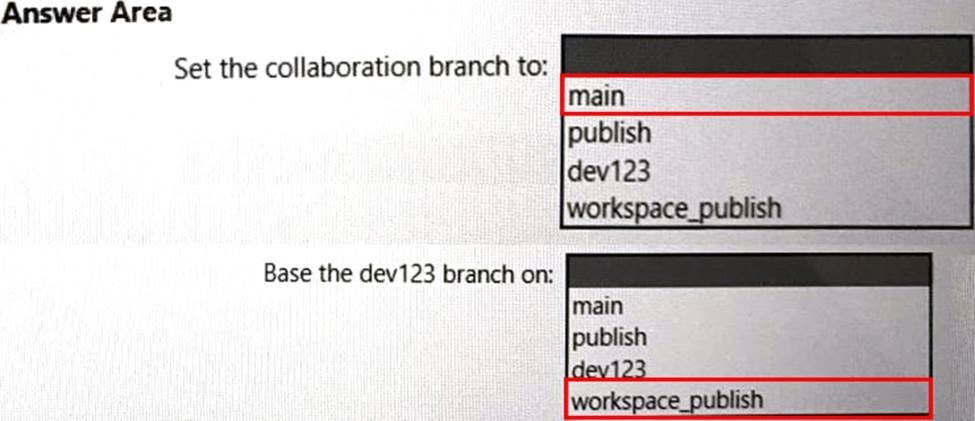
Explanation:
Box 1: main
Code must always be merged to the main branch before being published, and the main branch must be used for publishing resources.
Collaboration branch – Your Azure Repos collaboration branch that is used for publishing. By default, its master. Change this setting in case you want to publish resources from another branch. You can select existing branches or create new.
Each Git repository that’s associated with a Synapse Studio has a collaboration branch. (main or master is the default collaboration branch).
Box 2: workspace_publish
A branch named dev123 will be created to support the development of a new feature.
The workspace templates must be stored in the publish branch.
Creating feature branches
Users can also create feature branches by clicking + New Branch in the branch dropdown.
By default, Synapse Studio generates the workspace templates and saves them into a branch called workspace_publish. To configure a custom publish branch, add a publish_config.json file to the root folder in the collaboration branch.
Reference: https://docs.microsoft.com/en-us/azure/synapse-analytics/cicd/source-control
You need to provide users with a reproducible method to connect to a data source and transform the data by using an Al function.
The solution must meet the following requirement
• Minimize development effort.
• Avoid including data in the file.
Which type of file should you create?
- A . PBIDS
- B . PBIX
- C . PBIT
C
Explanation:
A PBIT file is a template created by Power BI Desktop, a Microsoft application used to create reports and visualizations. It contains queries, visualization settings, data models, reports, and other data added by the user.
A PBIT file acts as a Power BI template. It doesn’t include any data from your source systems.
Reference: https://docs.microsoft.com/en-us/power-bi/connect-data/desktop-data-sources
You are planning a Power Bl solution for a customer.
The customer will have 200 Power Bl users.
The customer identifies the following requirements:
• Ensure that all the users can create paginated reports.
• Ensure that the users can create reports containing Al visuals.
• Provide autoscaling of the CPU resources during heavy usage spikes.
You need to recommend a Power Bl solution for the customer. The solution must minimize costs.
What should you recommend?
- A . Power Bl Premium per user
- B . a Power Bl Premium per capacity
- C . Power Bl Pro per user
- D . Power Bl Report Server
A
Explanation:
Announcing Power BI Premium Per User general availability and autoscale preview for Gen2.
Power BI Premium per user features and capabilities
* Pixel perfect paginated reports are available for operational reporting capabilities based on SSRS technology. Users can create highly formatted reports in various formats such as PDF and PPT, which are embeddable in applications and are designed to be printed or shared.
* Automated machine learning (AutoML) in Power BI enables business users to build ML models to predict outcomes without having to write any code.
* Etc.
Note:
Power BI empowers every business user and business analyst to get amazing insights with AI infused experiences. With Power BI Premium, we enable business analysts to not only analyze and visualize their data, but to also build an end-to-end data platform through drag and drop experiences. Everything from ingesting and transforming data at scale, to building automated machine learning models, and analyzing massive volumes of data is now possible for our millions of business analysts.
Reference: https://powerbi.microsoft.com/nl-be/blog/announcing-power-bi-premium-per-user-general-availability-and-autoscale-preview-for-gen2/
HOTSPOT
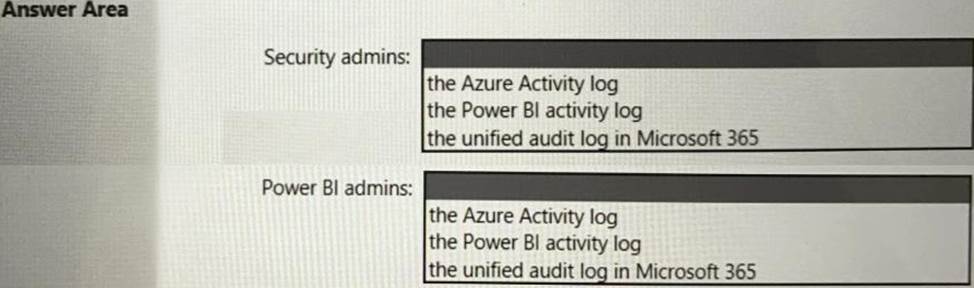
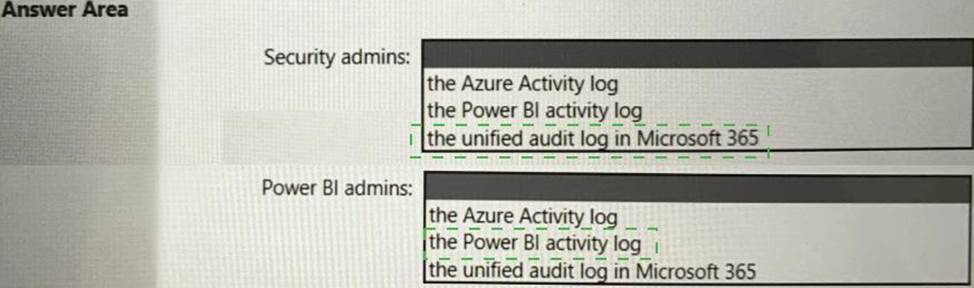
You need to recommend an automated solution to monitor Power Bl user activity.
The solution must meet the following requirements:
• Security admins must identify when users export reports from Power Bl within five days of a new sensitivity label being applied to the artifacts in Power Bl.
• Power Bl admins must identify updates or changes to the Power Bl capacity.
• The principle of least privilege must be used.
Which log should you include in the recommendation for each group? To answer, select the appropriate options in the answer area. NOTE: Each correct selection is worth one point.
Explanation:
Box 1: the unified audit log in Microsoft 365
Security admins must identify when users export reports from Power BI within five days of a new sensitivity label being applied to the artifacts in Power BI.
Use the audit log
If your task is to track user activities across Power BI and Microsoft 365, you work with auditing in Microsoft 365 compliance or use PowerShell. Auditing relies on functionality in Exchange Online, which automatically supports Power BI.
You can filter the audit data by date range, user, dashboard, report, dataset, and activity type. You can also download the activities in a csv (comma-separated value) file to analyze offline.
Box 2: Power BI activity log
Power BI admins must identify updates or changes to the Power BI capacity.
Use the activity log
Power BI administrators can analyze usage for all Power BI resources at the tenant level by using custom reports that are based on the Power BI activity log.
Reference: https://docs.microsoft.com/en-us/power-bi/admin/service-admin-auditing
You have a 2-GB Power Bl dataset.
You need to ensure that you can redeploy the dataset by using Tabular Editor. The solution must minimize how long it will take to apply changes to the dataset from powerbi.com.
Which two actions should you perform in powerbi.com? Each correct answer presents part of the solution. NOTE: Each correct selection is worth one point
- A . Enable service principal authentication for read-only admin APIs.
- B . Turn on Large dataset storage format.
- C . Connect the target workspace to an Azure Data Lake Storage Gen2 account.
- D . Enable XMLA read-write.
BD
Explanation:
Optimize datasets for write operations by enabling large models
When using the XMLA endpoint for dataset management with write operations, it’s recommended you enable the dataset for large models. This reduces the overhead of write operations, which can make them considerably faster. For datasets over 1 GB in size (after compression), the difference can be significant.
Tabular Editor supports Azure Analysis Services and Power BI Premium Datasets through XMLA read/write.
Note: Tabular Editor – An open-source tool for creating, maintaining, and managing tabular models using an intuitive, lightweight editor. A hierarchical view shows all objects in your tabular model. Objects are organized by display folders with support for multi-select property editing and DAX syntax highlighting. XMLA read-only is required for query operations. Read-write is required for metadata operations.
Reference: https://docs.microsoft.com/en-us/power-bi/enterprise/service-premium-connect-tools https://tabulareditor.github.io/
You have five Power Bl reports that contain R script data sources and R visuals.
You need to publish the reports to the Power Bl service and configure a daily refresh of datasets.
What should you include in the solution?
- A . a Power Bl Embedded capacity
- B . an on-premises data gateway (standard mode)
- C . a workspace that connects to an Azure Data Lake Storage Gen2 account
- D . an on-premises data gateway (personal mode)
B
Explanation:
To schedule refresh of your R visuals or dataset, enable scheduled refresh and install an on-premises data gateway (personal mode) on the computer containing the workbook and R.
Reference: https://docs.microsoft.com/en-us/power-bi/connect-data/desktop-r-in-query-editor
You have new security and governance protocols for Power Bl reports and datasets.
The new protocols must meet the following requirements.
• New reports can be embedded only in locations that require authentication.
• Live connections are permitted only for workspaces that use Premium capacity datasets.
Which three actions should you recommend performing in the Power Bl Admin portal? Each correct answer presents part of the solution. NOTE: Each correct selection is worth one point.
- A . From Tenant settings, disable Allow XMLA endpoints and Analyze in Excel with on-premises datasets.
- B . From the Premium per user settings, set XMLA Endpoint to Off.
- C . From Embed Codes, delete all the codes.
- D . From Capacity settings, set XMLA Endpoint to Read Write.
- E . From Tenant settings, set Publish to web to Disable.
ADE
Explanation:
Reference:
https://docs.microsoft.com/en-us/power-bi/enterprise/service-premium-connect-tools
https://powerbi.microsoft.com/en-us/blog/power-bi-february-service-update
You have an Azure Synapse Analytics serverless SQL pool.
You need to catalog the serverless SQL pool by using Azure Purview.
Which three actions should you perform? Each correct answer presents part of the solution. NOTE: Each correct selection is worth one point.
- A . Create a managed identity in Azure Active Directory (Azure AD).
- B . Assign the Storage Blob Data Reader role to the Azure Purview managed service identity (MSI) for the storage account associated to the Synapse Analytics workspace.
- C . Assign the Owner role to the Azure Purview managed service identity (MSI) for the Azure Purview resource group.
- D . Register a data source.
- E . Assign the Reader role to the Azure Purview managed service identity (MSI) for the Synapse Analytics workspace.
ABE
Explanation:
Authentication for enumerating serverless SQL database resources
There are three places you’ll need to set authentication to allow Microsoft Purview to enumerate your serverless SQL database resources:
The Azure Synapse workspace
The associated storage
The Azure Synapse serverless databases
The steps below will set permissions for all three.
Azure Synapse workspace
In the Azure portal, go to the Azure Synapse workspace resource.
On the left pane, select Access Control (IAM).
Select the Add button.
Set the Reader role and enter your Microsoft Purview account name, which represents its managed service identity (MSI).
Select Save to finish assigning the role
Azure Synapse Analytics serverless SQL pool catalog Purview Azure Purview managed service identity
Storage account
In the Azure portal, go to the Resource group or Subscription that the storage account associated with the Azure Synapse workspace is in.
On the left pane, select Access Control (IAM).
Select the Add button.
Set the Storage blob data reader role and enter your Microsoft Purview account name (which
represents its MSI) in the Select box.
Select Save to finish assigning the role.
Azure Synapse serverless database
Go to your Azure Synapse workspace and open the Synapse Studio.
Select the Data tab on the left menu.
Select the ellipsis (…) next to one of your databases, and then start a new SQL script.
Add the Microsoft Purview account MSI (represented by the account name) on the serverless SQL databases. You do so by running the following command in your SQL script: SQL
CREATE LOGIN [PurviewAccountName] FROM EXTERNAL PROVIDER; Apply permissions to scan the contents of the workspace
You can set up authentication for an Azure Synapse source in either of two ways. Select your scenario below for steps to apply permissions.
Use a managed identity
Use a service principal
Reference: https://docs.microsoft.com/en-us/azure/purview/register-scan-synapse-workspace?tabs=MI
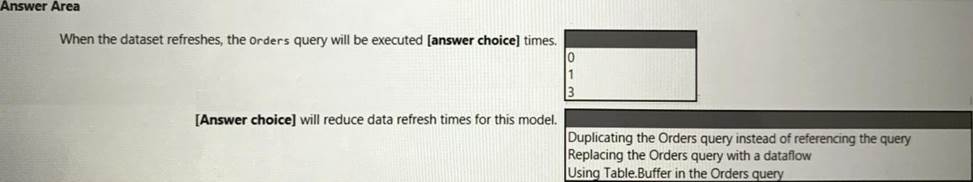
HOTSPOT
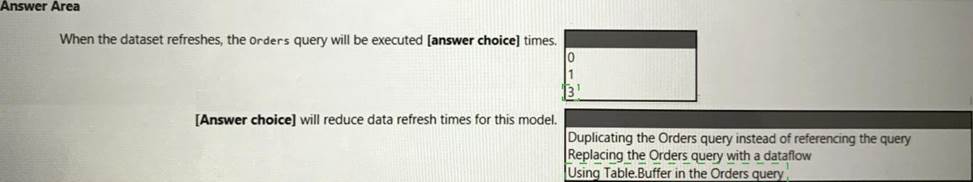
You have a Power Bl dataset that has the query dependencies shown in the following exhibit.
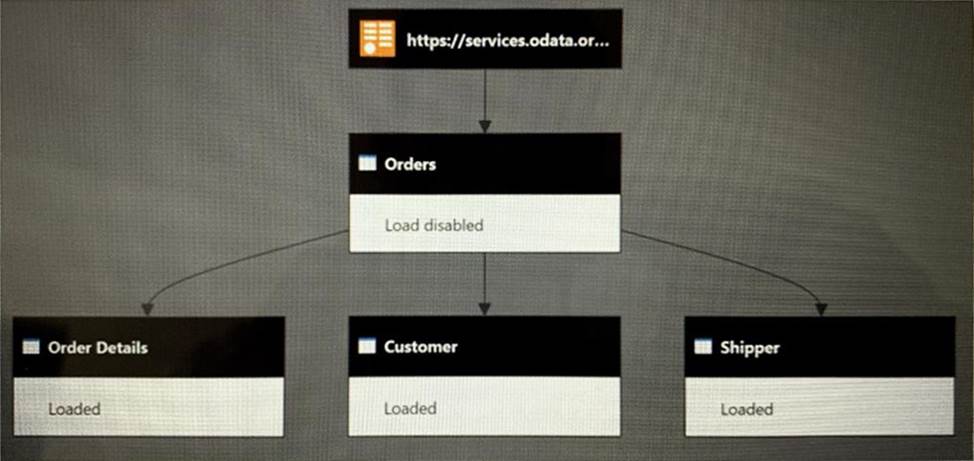

Use the drop-down menus to select the answer choice that completes each statement based on the information presented in the graphic. NOTE: Each correct selection is worth one point.

Explanation:
Box 1: 3
Power Query doesn’t start at the first query and work down, it starts at the bottom (last) query and works backwards, so 3 tables from 1 will cause it to process that first source table 3 times.
Box 2: Using Table.Buffer in the Orders query
Table.Buffer buffers a table in memory, isolating it from external changes during evaluation. Buffering is shallow. It forces the evaluation of any scalar cell values, but leaves non-scalar values (records, lists, tables, and so on) as-is.
Note that using this function might or might not make your queries run faster. In some cases, it can make your queries run more slowly due to the added cost of reading all the data and storing it in memory, as well as the fact that buffering prevents downstream folding.
Example 1
Load all the rows of a SQL table into memory, so that any downstream operations will no longer be able to query the SQL server.
Usage
let
Source = Sql.Database("SomeSQLServer", "MyDb"), MyTable = Source{[Item="MyTable"]}[Data], BufferMyTable = Table.Buffer(dbo_MyTable)
in
BufferMyTable
Output
table
Reference:
https://radacad.com/performance-tip-for-power-bi-enable-load-sucks-memory-up
https://docs.microsoft.com/en-us/powerquery-m/table-buffer
DRAG DROP
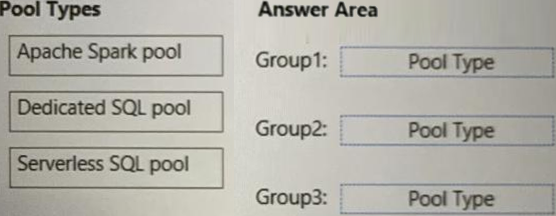
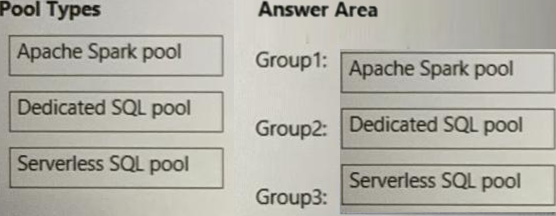
You are configuring Azure Synapse Analytics pools to support the Azure Active Directory groups shown in the following table.
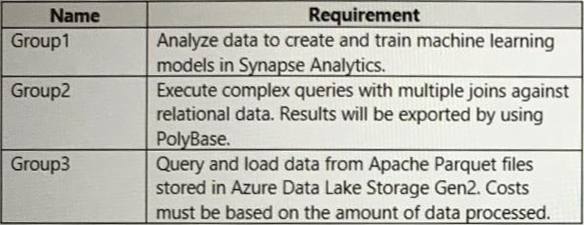

Which type of pool should each group use? To answer, drag the appropriate pool types to the groups. Each pool type may be used once, more than once, or not at all. You may need to drag the split bar between panes or scroll to view content. NOTE: Each correct selection is worth one point.

Explanation:
Box 1: Apache Spark pool
An Apache Spark pool provides open-source big data compute capabilities. After you’ve created an Apache Spark pool in your Synapse workspace, data can be loaded, modeled, processed, and distributed for faster analytic insight.
Box 2: Dedicated SQL Pool
Dedicated SQL Pool – Data is stored in relational tables
Box 3: Serverless SQL pool
Serverless SQL pool – Cost is incurred for the data processed per query
Reference:
https://docs.microsoft.com/en-us/azure/synapse-analytics/quickstart-create-apache-spark-pool-portal
https://www.royalcyber.com/blog/data-services/dedicated-sql-pool-vs-serverless-sql/
You are running a diagnostic against a query as shown in the following exhibit.
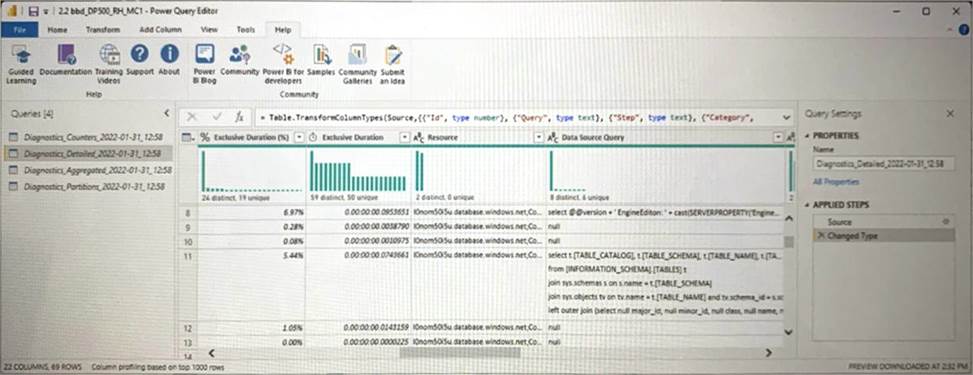

What can you identify from the diagnostics query?
- A . All the query steps are folding.
- B . Elevated permissions are being used to query records.
- C . The query is timing out.
- D . Some query steps are folding.
A
Explanation:
Understanding folding with Query Diagnostics
One of the most common reasons to use Query Diagnostics is to have a better understanding of what operations were ‘pushed down’ by Power Query to be performed by the back-end data source, which is also known as ‘folding’. If we want to see what folded, we can look at what is the ‘most specific’
query, or queries, that get sent to the back-end data source. We can look at this for both ODATA and SQL.
Reference: https://docs.microsoft.com/en-us/power-query/querydiagnosticsfolding