
By definition, Tableau displays measures over time as a ____________
A . Packed Bubble
B . Bar
C . Stacked Bar
D . Line
Answer: D
Explanation:
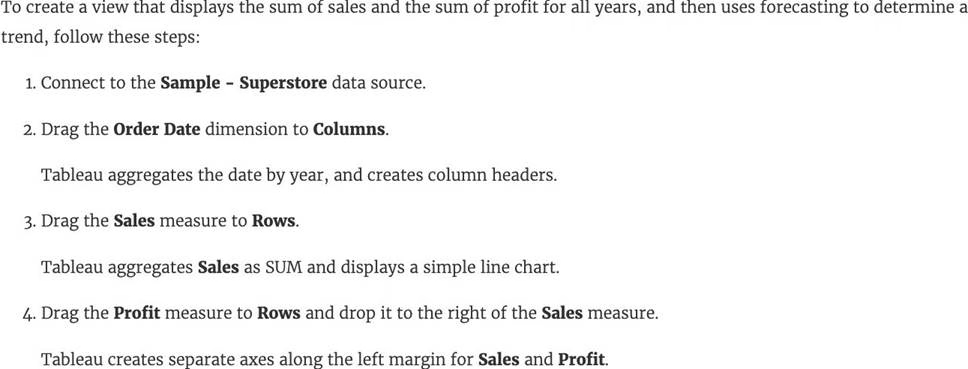
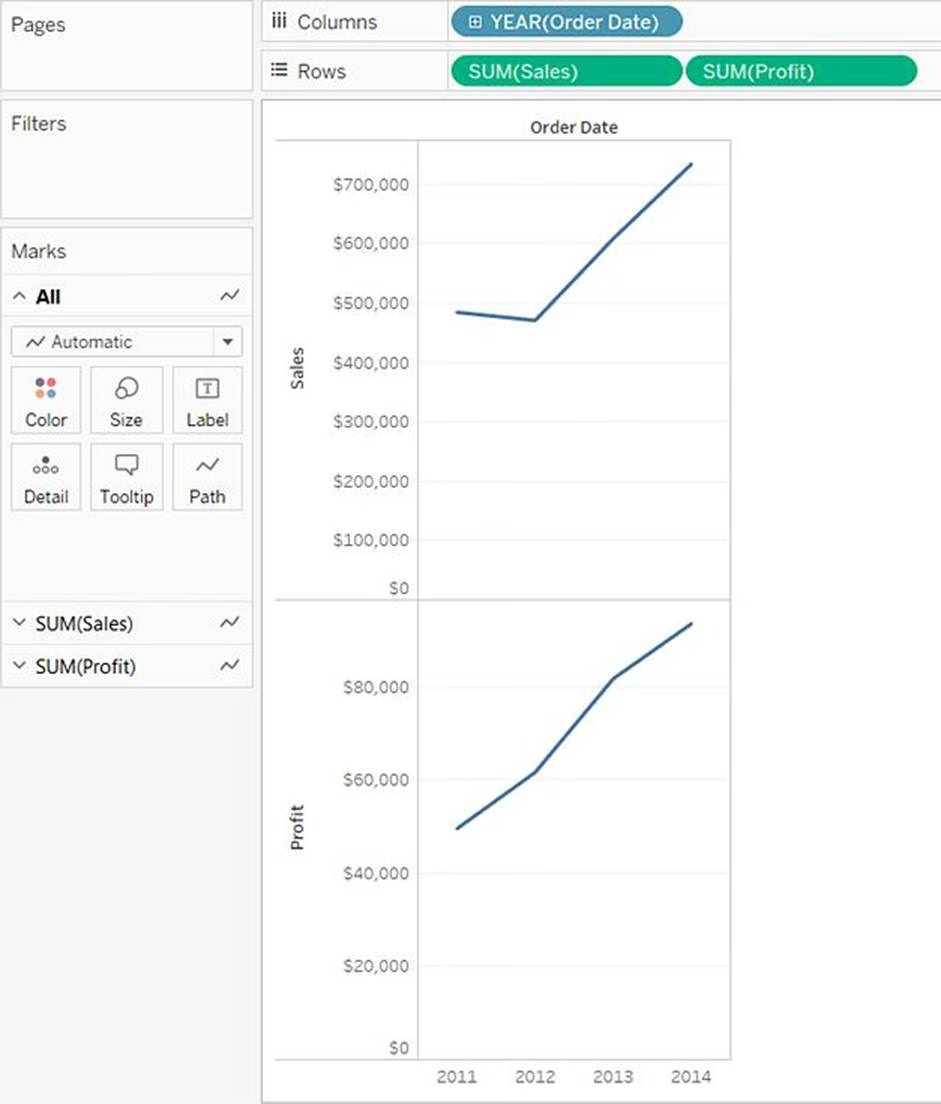
Line charts connect individual data points in a view. They provide a simple way to visualize a sequence of values and are useful when you want to see trends over time, or to forecast future values.
Please refer to the images below:
Reference: https://help.tableau.com/current/pro/desktop/en-us/buildexamples_line.htm
Latest TDS-C01 Practice Questions with 151 Q&As
Updated Study Material | Instant Download | Detailed Answers and Explanations