Refer to the exhibit.
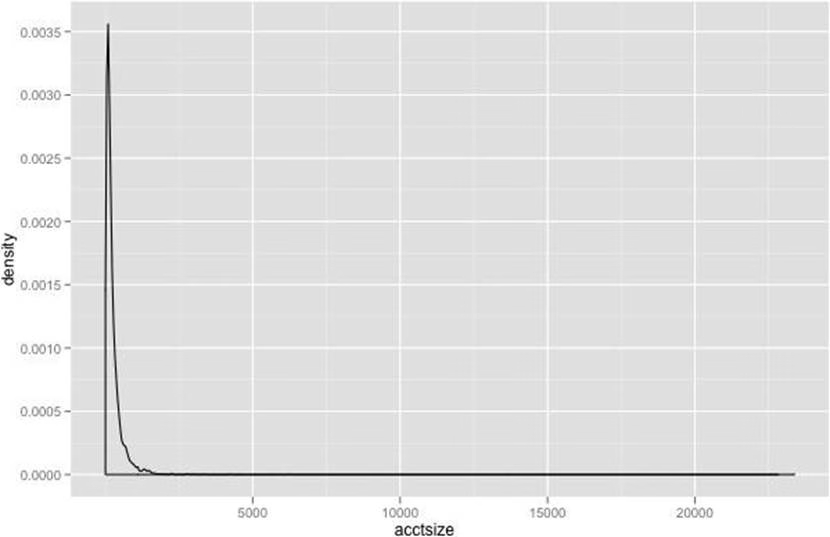
You have plotted the distribution of savings account sizes for your bank.
How would you proceed, based on this distribution?
A . The data is extremely skewed. Replot the data on a logarithmic scale to get a better sense of it.
B . The data is extremely skewed, but looks bimodal; replot the data in the range 2, 500-10, 000 to be sure.
C . The accounts of size greater than 2500 are rare, and probably outliers. Eliminate them from your future analysis.
D . The data is extremely skewed. Split your analysis into two cohorts: accounts less than 2500, and accounts greater than 2500
Answer: A
Latest D-DS-FN-23 Dumps Valid Version with 300 Q&As
Latest And Valid Q&A | Instant Download | Once Fail, Full Refund
