Which of the following can be explained from the chart below?
A . Users have not started the sprint yet.
B. Users deleted the sprint.
C. Users closed some issues the moment the sprint started.
D. There are no issues in the sprint.
Answer: C
Explanation:
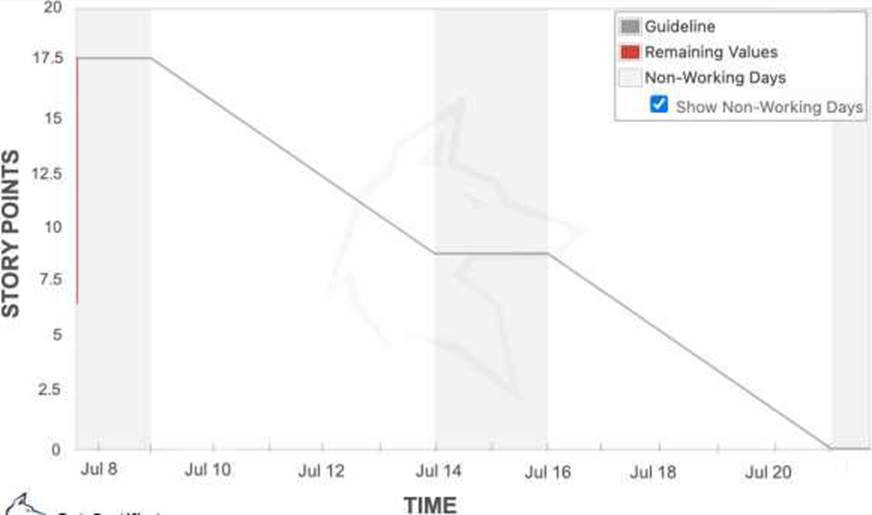
If the grey ‘guideline’ line does not show, the sprint may have been started before any issues were assigned to it.
In this case, since the grey ‘guideline’ line does show up in the chart, the sprint already started. The ‘remaining values’ line indicates that someone closed some issues that are worth 5 story points as soon as they started their sprint.
Latest ACP-620 Dumps Valid Version with 150 Q&As
Latest And Valid Q&A | Instant Download | Once Fail, Full Refund
