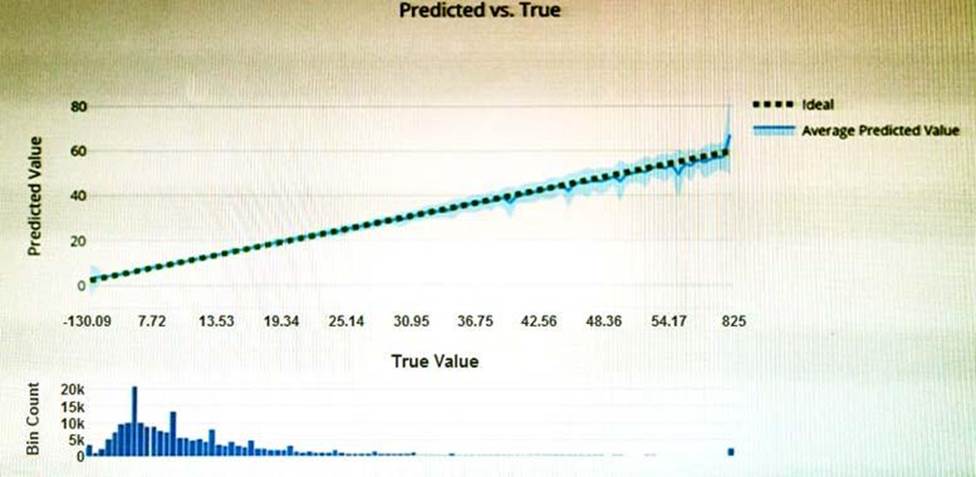
You have the Predicted vs. True chart shown in the following exhibit.
Which type of model is the chart used to evaluate?
A . classification
B. regression
C. clustering
Answer: B
Explanation:
What is a Predicted vs. True chart?
Predicted vs. True shows the relationship between a predicted value and its correlating true value for a regression problem. This graph can be used to measure performance of a model as the closer to the y=x line the predicted values are, the better the accuracy of a
predictive model.
Explanation:
Reference: https://docs.microsoft.com/en-us/azure/machine-learning/how-to-understand-automated-m
Latest AI-900 Dumps Valid Version with 85 Q&As
Latest And Valid Q&A | Instant Download | Once Fail, Full Refund
